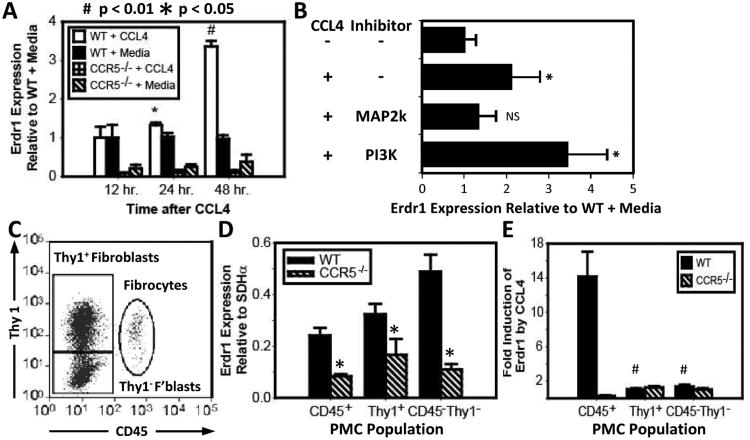
Figure 2. Stimulation of Ccr5 on PMCs induces expression ofErdr1.
(A) Erdr1 expression by real time PCR after Ccl4 treatment. WT and Ccr5-/- PMCs were stimulated with 50 ng/ml of Ccl4 after overnight culture in serum-free media. mRNA was harvested at 0, 24, and 48 hours. Bar graph shows expression of Erdr1 normalized to baseline expression in WT PMCs. Significant increases in Erdr1 expression were detectable in WT PMCs at 24 and 48 hours. No significant changes were noted in Ccr5-/- PMCs. (B) The response of Erdr1 to Ccl4 following treatment with 10μM of the MAP2K inhibitor U0129 and 20 μM of the PI3K inhibitor LY294002. Erdr1 expression is inhibited by U0129 (3rd bar) but not LY294002 (4th bar). (C) PMC subpopulations. The dot plot shows flow cytometric analysis of PMC populations as defined by CD45 and Thy-1. (D) Bar graph showing Erdr1 expression in PMCs sorted by CD45 and Thy-1. All subpopulations of WT cells expressed more Erdr1 than Ccr5-/- (p < 0.05). (E) Bar graph shows induction of Erdr1 after stimulation with Ccl4 in PMC subpopulations. PMCs were sorted 48 hours after treatment with 50 ng/ml of Ccl4. Only WT CD45+ PMCs exhibited a significant increase in Erdr1 expression (p < 0.01).

