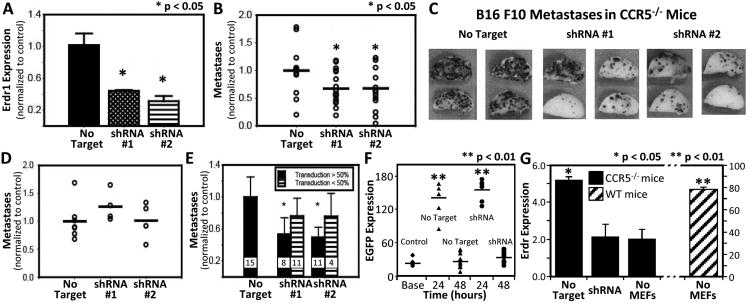
Figure 3. Inhibition ofErdr1inhibits metastasis.
(A) Real-time PCR measurement of Erdr1 expression in MEFs 48 hours after transduction with shRNA retroviral constructs. Results normalized to MEFs transduced with control plasmid. (B) Graph showing number of B16-F10 metastases in Ccr5-/- mice injected with MEFs transduced with control (left), shRNA#1 (middle), or shRNA#2 (right). Mice were injected with 4×10⁵ MEFs 24 hours before injection with 7.5 × 10⁵ melanoma cells. Metastases are normalized to mice treated with control MEFs; results are pooled from three different experiments. (C) Photographs of the lungs (left upper lobe) of representative mice described in (B). (D) Graph showing metastases in WT mice injected with control or shRNA transduced MEFs. Results normalized to control MEF group. (E) Bar graph representing the number of B16-F10 metastases in Ccr5-/- mice. Black bars represent mice that received more than 50% transduced MEFs; striped bars are mice that received less than 50% transduced MEFs. The sample sizes are given just above the x-axis. (F) The graph shows the amount of eGFP detected from the lung of Ccr5-/- injected with MEFs that had been transduced with control or shRNA plasmids. eGFP was detected by ELISA. First column on the left is eGFP expression in mice injected with unmanipulated MEFs. (G) Real time PCR measurement of Erdr1 in the lung of Ccr5-/- mice 24 hours after injection with 4×10⁵ MEFs transduced with control or shRNA. Columns on the right show Erdr1 expression of Ccr5-/- and WT mice without MEF injection.

