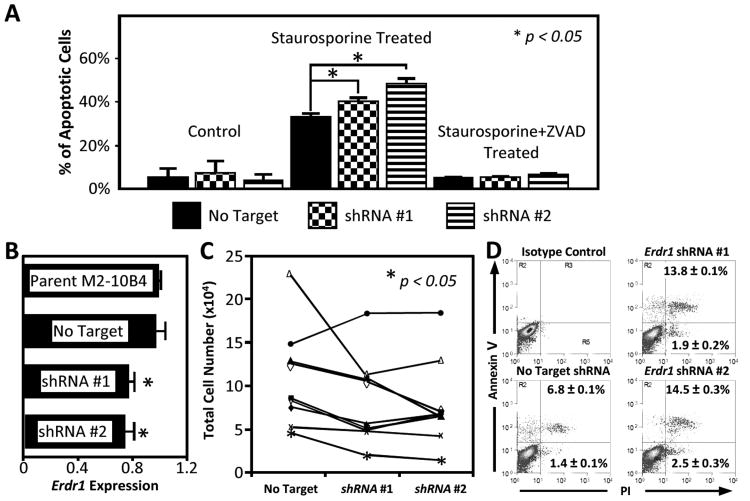
Figure 4. Inhibition ofErdr1promotes apoptosis of primary chronic lymphocytic leukemia cells.
(A) Effect of Erdr1 knockdown on staurosporine induced apoptosis. MEFs were transduced with Erdr1 knockdown or control shRNA and were treated with or without staurosporine (100 nM). The bar graph shows a disproportionate increase the apoptosis of MEFs treated with Erdr1 shRNA. The differences between control and knockdown shRNA transduced cells were lost when the caspase inhibitor Z-VAD-FMK was added. (B) Erdr1 expression in M2-10B4 cell lines. Results are expressed relative to the parent line (top). The bottom three lines are stable clones transduced with non-target control, shRNA#1, or shRNA#2 plasmids. (C) Total cell number of CLL cells co-cultured with M2-10B4 clones. Each line represents a sample from an individual patient. The points on the left are the cell number after culture with non-targeted control M2-10B4 cells. The points in the center and right are numbers after culture with shRNA knockdown lines. Cells were harvested after 96 hours of culture. (D) Representative sample dot plots of CLL samples co-cultured with M2-10B4 clones. The mean ± SEM is given for all 10 CLL samples.

