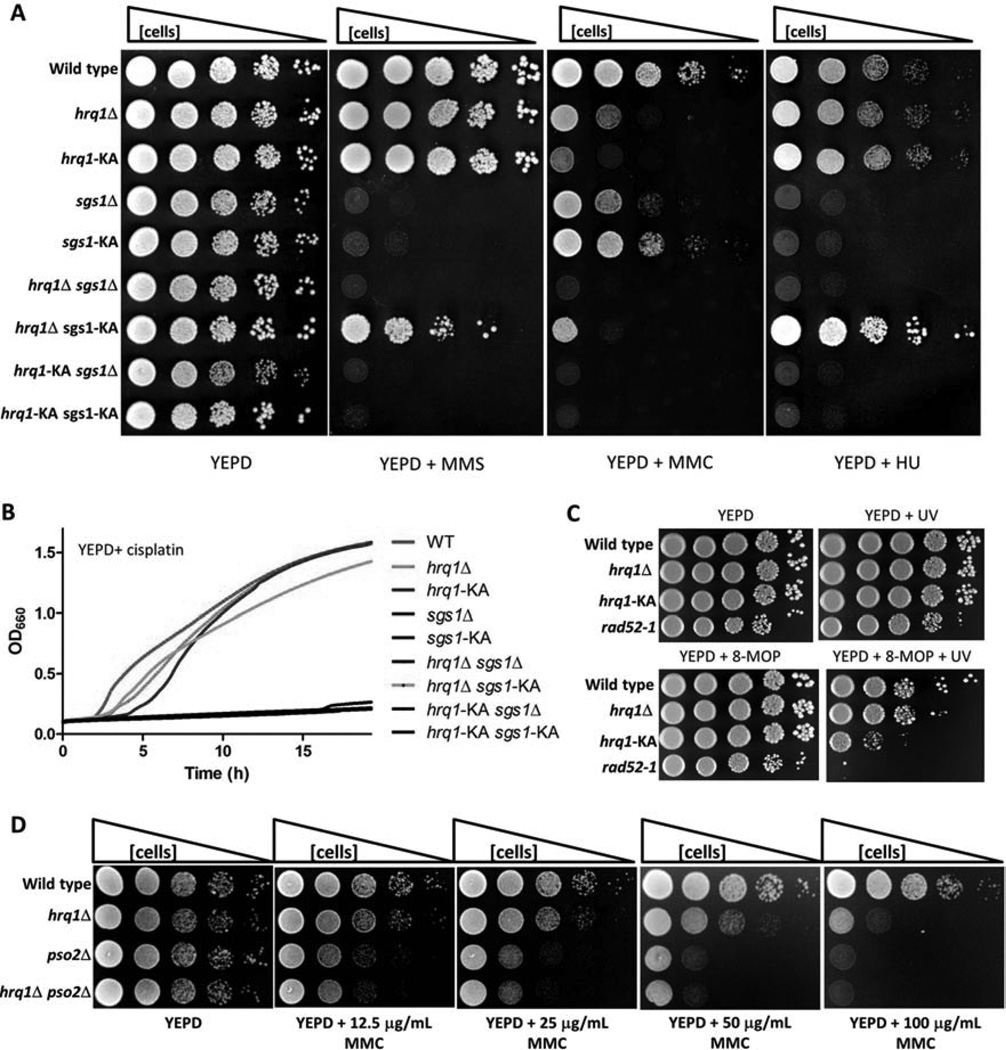
Figure 2. Comparison of hrq1 and sgs1 DNA damage sensitivity.
(A) Growth of the indicated strains on YEPD and YEPD containing 0.03% MMS, 100 µg/mL MMC, or 100 mM HU. Cells of the indicated genotype were grown in liquid culture, diluted to OD660=1, and 10-fold serial dilutions were spotted onto plates, which were then incubated for 2 (YEPD), 3 (MMS and MMC), or 4 (HU) days in the dark. (B) Growth curves of the indicated strains displaying relative sensitivity to cisplatin. Cells were grown overnight in YEPD, diluted to OD660=0.1 in a 96-well plate, and incubated at 30°C in a BioTek EON plate reader with shaking. The OD660 was then measured every 15 min for 24 h. The plotted values are the means of ≥3 independent experiments per strain. (C) 8-MOP+UV sensitivity of the indicated strains. Cells were grown, diluted, and spotted (as in A) on YEPD plates or YEPD plates containing 20 µM 8-MOP and either placed in an opaque container (YEPD and YEPD+8-MOP) or exposed to 365-nm UV for 5 (YEPD+8-MOP+UV) or 15 min (YEPD+UV) and then incubated in the dark for 2 days. The images are representative of results from triplicate experiments. (D) hrq1Δ and pso2Δ are epistatic for MMC sensitivity. Cells were grown, diluted, and spotted (as in A) on YEPD or YEPD+MMC plates and incubated for 2 days. See also Figures S2 and S3.

