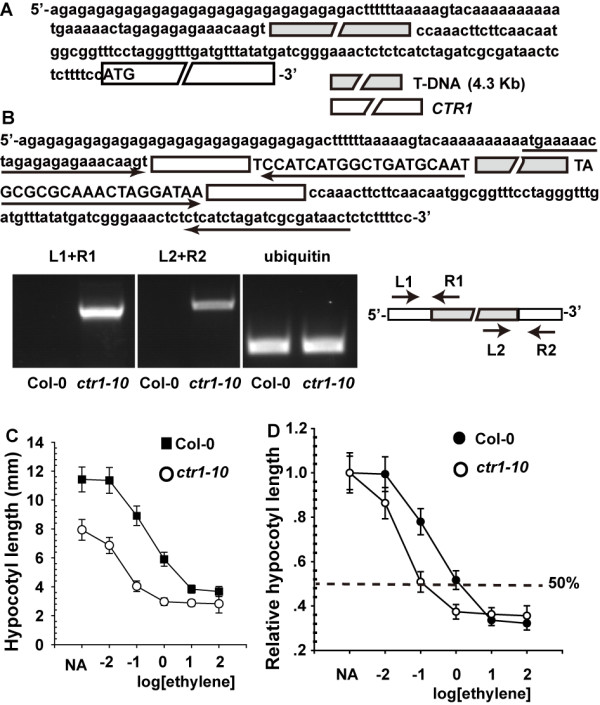
Figure 1.

Gene structure and ethylene-dose response assay of the mutant constitutive triple response 1–10 (ctr1-10). (A)ctr1-10 gene structure and cDNA sequence flanking the T-DNA. The T-DNA is in gray and CTR1 coding region white. (B) The T-DNA sequence is transcribed as part of the ctr1-10 5′-untranslated region (5′-UTR). Arrows indicate the primer orientation and corresponding cDNA sequences for RT-PCR. Capital letters are the T-DNA sequence and lowercase letters are the CTR1 cDNA sequence. T-DNA is in gray and the 5′-UTR white. RT-PCR analysis of gene expression. Ethylene dose–response assay for hypocotyl measurement (C) and relative hypocotyl length (D) of etiolated wild-type (Col-0) and ctr1-10 seedlings. The dotted line in (D) indicates 50% growth inhibition. Data are mean ± SD (n ≥ 20).
