Figure 3.

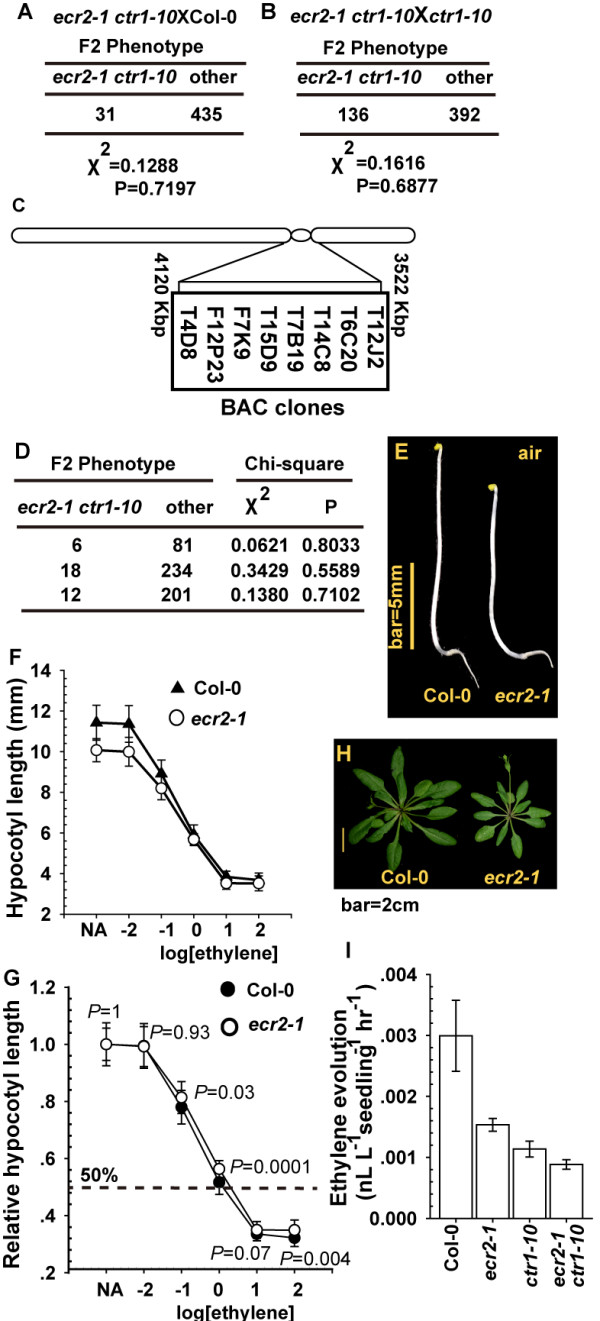
Isolation of ecr2-1. (A) and (B) Genetic analyses and chi-square test of ecr2-1. Numbers are individuals scored in the F2 generation. Other: other phenotype that is not ecr2-1 ctr1-10 growth inhibition phenotype. (C)ECR2 is mapped to a region spanning the centromere at chromosome 2, and the BAC clones are indicated. (D) Results for 3 independent test crosses for ecr2-1 with ctr1-10. Phenotype (E) and ethylene dose–response assay for the hypocotyl measurement (F) and relative hypocotyl length (G) of etiolated wild-type (Col-0) and ecr2-1 seedlings. The dotted line indicates 50% growth inhibition for (G); P values for Student’s t test are indicated. (H) Rosette phenotype of ecr2-1. (I) Ethylene evolution of light-grown seedlings (5 days after germination). Data are mean±SD of 3 independent measurements.
