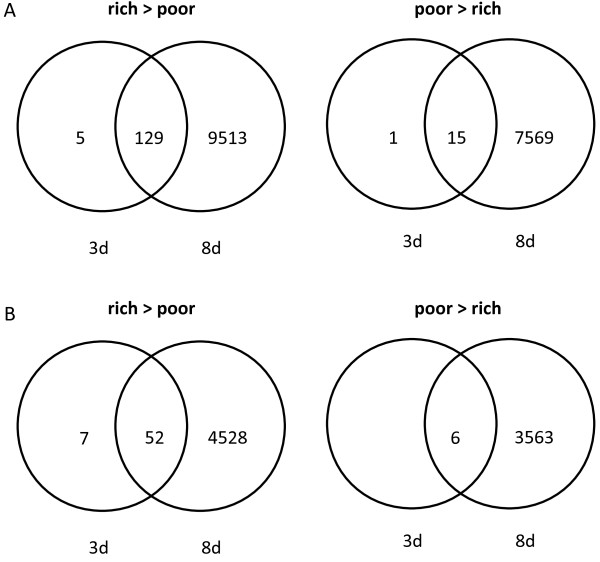
Figure 2.
The impact of diet on bees aged 3 days or 8 days. The number of (A) annotated transcripts and (B) orthologues differentially expressed as a function of diet in bees fed a rich or poor diet for 3d or 8d. Panels on the left (rich > poor) represent terms down-regulated with starvation. Panels on the right (poor > rich) represent terms whose expression was higher in bees fed a poor diet.

