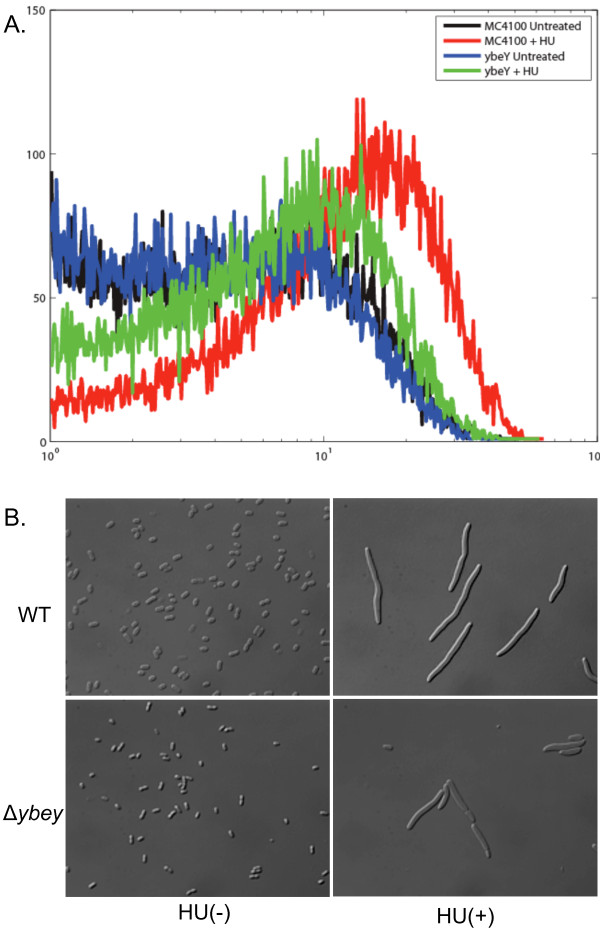
Figure 7.
Physiology of ΔybeY as compared WT bacteria. During HU exposure ΔybeY cells have reduced production of reactive oxygen species than WT (A), possibly leading to their better survival (Figure 1). FACS analysis was carried out as described in Methods. (B) represents microscopic states of WT and ΔybeY cells during absence (HU-) and presence of HU (HU+).

