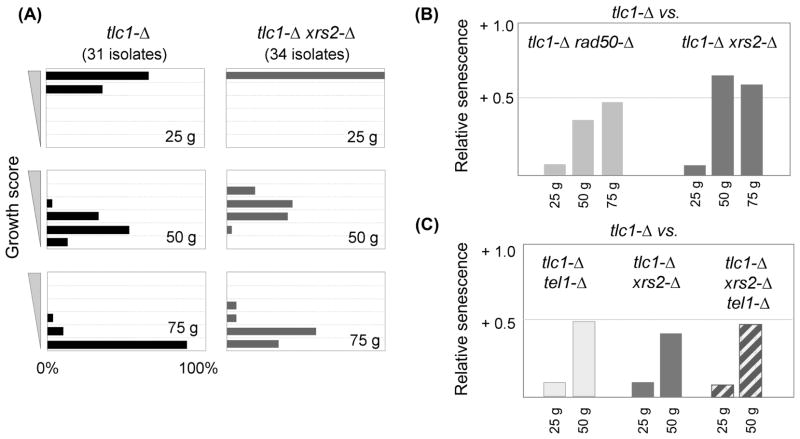
Fig. 1. The MRX complex and Tel1 regulate senescence through a common pathway.
(A) Histogram of the senescence phenotypes of 31 tlc1-Δ isolates and 34 tlc1-Δ xrs2-Δ isolates, as the percentage displaying a particular growth score (on a scale of 1 to 6) at ~25, ~50 and ~75 generations (abbreviated “g”). (B) Average senescence scores of 34 tlc1-Δ xrs2-Δ isolates or 25 tlc1-Δ rad50-Δ isolates, relative to the average score of 31 or 39 tlc1-Δ isolates, respectively, where a positive value corresponds to an attenuated senescence phenotype (relative to that of the tlc1-Δ isolates). (C) Relative senescence scores for the three indicated genotypes generated from a tlc1-Δ/TLC1 xrs2-Δ/XRS2 tel1-Δ/TEL1 diploid strain; the average of two experiments is shown, corresponding to a total of 66 tlc1-Δ, 77 tlc1-Δ xrs2-Δ, 50 tlc1-Δ tel1-Δ and 68 tlc1-Δ xrs2-Δ tel1-Δ isolates. Senescence was monitored for only ~50 generations in this experiment, because telomerase-defective strains derived from this diploid strain senesced faster, compared to the senescence progression shown in Fig. 1A.

