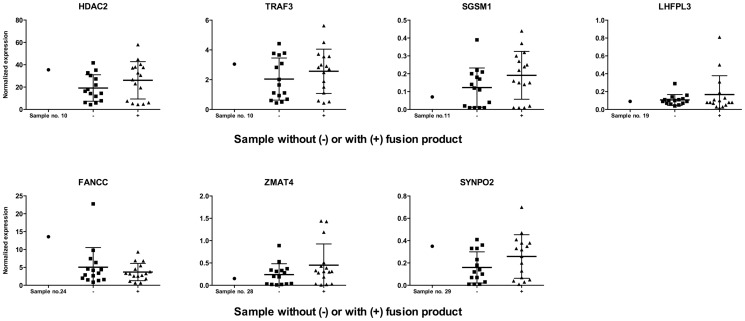
Figure 3. Expression intensities for genes affected by HPV integration.
The expression of a gene, affected by HPV integration in one sample, is compared to the expression of that gene in samples where exclusively episomal PCR products could be detected using APOT- and/or DIPS-PCR, and to the expression in samples where fusion products could be identified. Bars: Mean with standard deviation.

