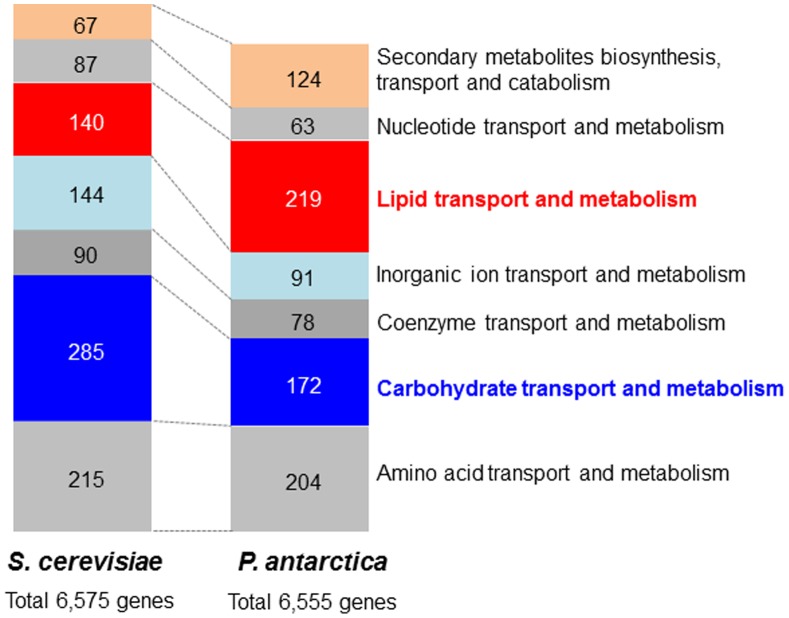
Figure 2. Comparison of the number of genes categorized on the basis of KOG classification between P. antarctica and S. cerevisiae.
The number of genes categorized in KOG relating metabolism were shown in bar chart. The categories shown are as follows; Q, secondary metabolisoms, transport and catabolism; F, nucleotide transport and metabolism; I, lipid transport and metabolism; P, inorganic ion transport and metabolism; H, coenzyme transport and metabolism; G, carbohydrate transport and metabolism; E, amino acid transport and metabolism.

