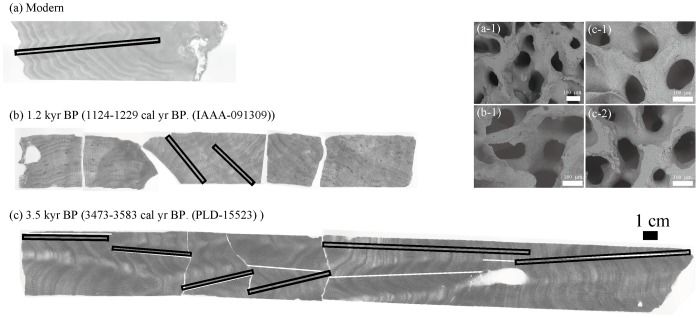
Figure 2. Positive X-radiograph and scanning electron microscope (SEM) images of (a) modern, (b) 1.2 kyr BP, and (c) 3.5 kyr BP Porites coral slabs.
Black lines in (a) and (b) indicate the position of the micro-sampling and growth analysis transects. In (c), white and black lines indicate the micro-sampling and growth analysis line, respectively. The SEM images of (a-1) modern, (b-1) 1.2 kyr BP and (c-1) top growth and (c-2) bottom growth areas of 3.5 kyr BP slabs.

