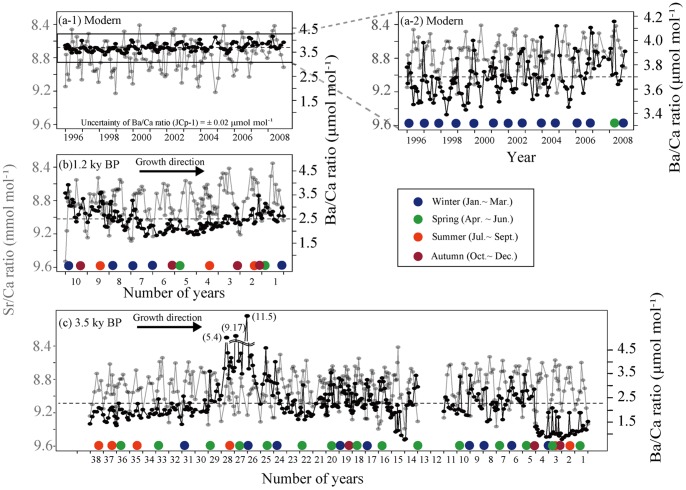
Figure 6. Plots of Sr/Ca (gray line) and Ba/Ca (black line) ratios as time series for one modern (a-1 and a-2), and two fossil (b and c) Porites corals.
(a-2) is the magnification of (a-1) at Nagura Bay. Color circles indicate high Ba/Ca. Dashed horizontal lines indicate the average Ba/Ca ratio in each coral.

