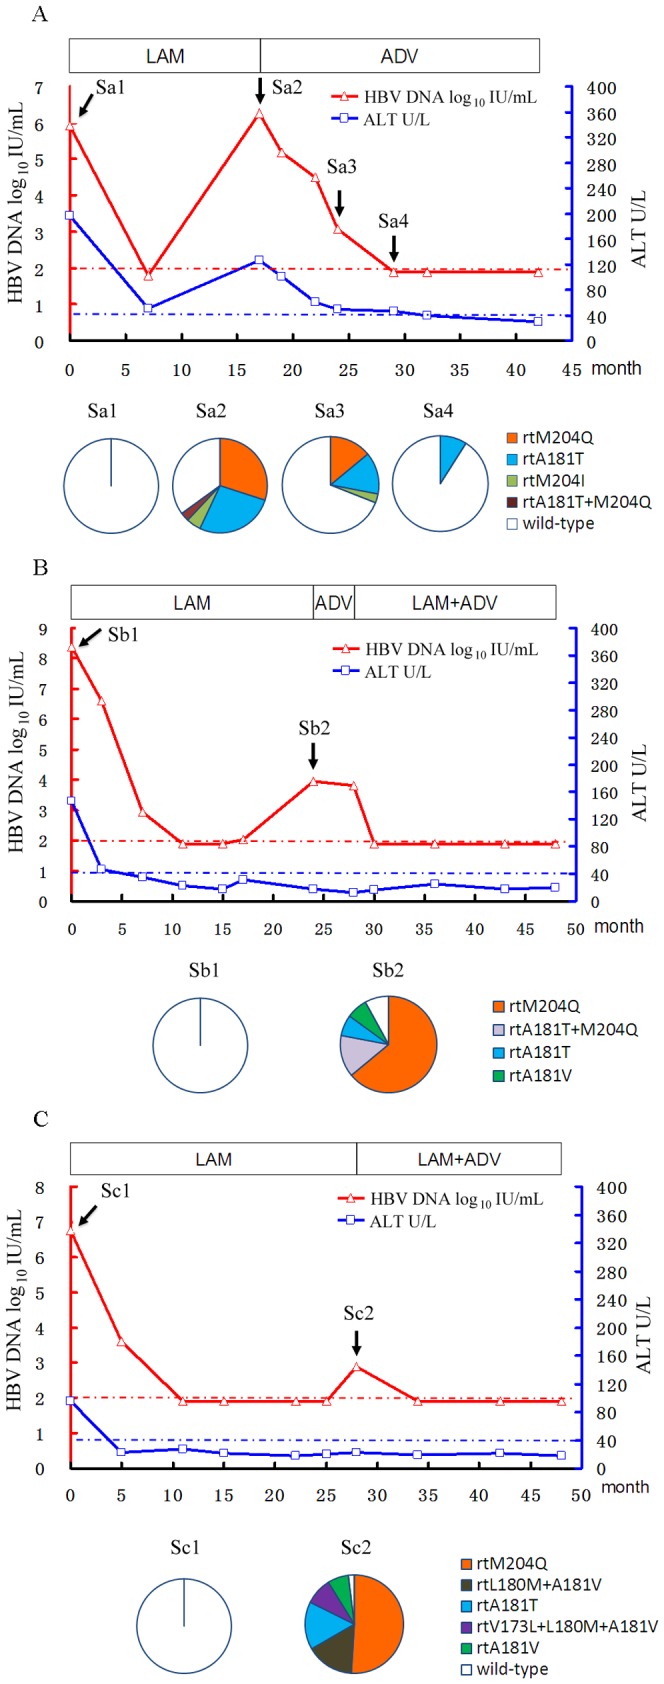
Figure 1. Follow-up the clinical course of three representative patients with HBV rtM204Q mutant during antiviral treatment.

The dynamic changes of serum HBV DNA and alanine aminotransferase (ALT) levels are shown along with the successive antiviral therapies for patient 1 (A), patient 4 (B), and patient 6 (C). The duration (months) of the therapies for antivirals is indicated by bars and the successfully-sequenced samples are indicated by arrows with sample (S) numbers above the graph. The dashed red and blue lines show the lower detection limit of HBV DNA and normal ALT levels, respectively. Proportions of wild-type and mutant strains in the viral reverse transcriptase domain of each sample are depicted by a series of pie-charts. ADV, adefovir dipivoxil; LAM, lamivudine.
