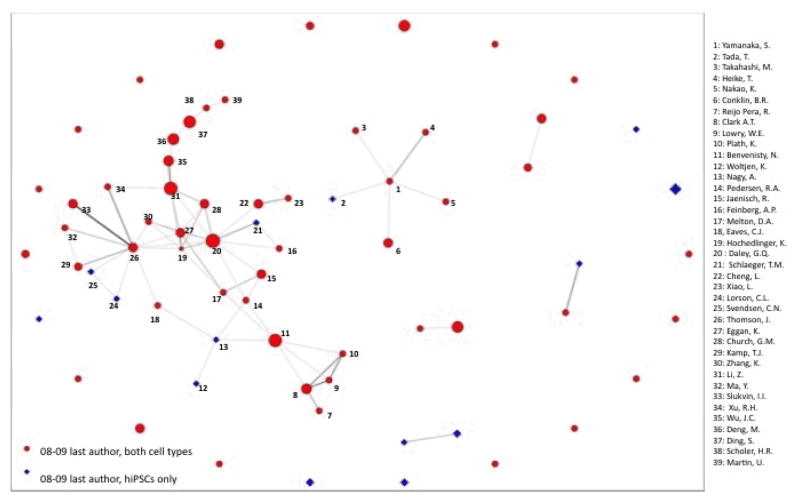
Figure 4. Last Authors using hIPSC, 2008–2009.
This network image represents co-authorship connections among the 69 last authors working with hiPSCs in 2008–09. 33 (47.33%) last authors are indirectly connected to each other by prior co-authorship ties in the network component to the left of the figure. That component is dominated by researchers at Harvard and the University of Wisconsin. Six other last authors are connected in the “star” centered on Shinya Yamanaka near the center of the figure. 22 hiPSC last authors (31.88%, arrayed in a circle) are part of the larger co-authorship network in Fig3, but have nut co-authored with another hiPSC last author in our data. Members of the two largest network components are labeled.

