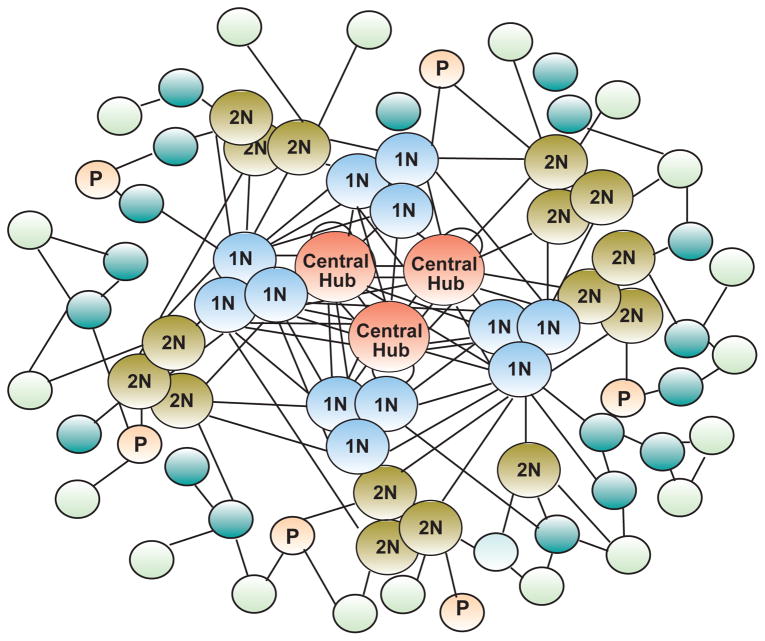
Figure 1.
The general organization of a biological network. The individual elements composing the network interact with each other. Some of these elements (P, portals) receive information from the environment; others, function mostly within the network. The central “hubs” or “nodes” are strongly interconnected and direct the flow of information throughout the entire network. Subordinate nodes respond to commands emanating from the central hubs; this information can be relayed to them either directly or via first (1N) and (2N) second “neighbors”. The architectural arrangement of the network is such that they contain “upper echelon” nodes that are highly interconnected, and a multitude of peripheral nodes that become increasing less connected as they move away from the major hubs. The arrangement of first and second nodes in clusters of three illustrates the concept that the network contains “modules”, i.e. sub-groups of genes with highly related functions. Depending on the data type, interactions between nodes (termed “edges”) may represent co-expression, physical association, transcriptional control, or other types of gene or gene product interactions. The nodes are colored according to their relative position within the network: orange = central nodes; light blue = first neighbors; light brown = second neighbors; light orange = portal nodes; dark blue = subordinate nodes located sub-peripherally; light green = most peripherally located nodes.

