
Figure 9.
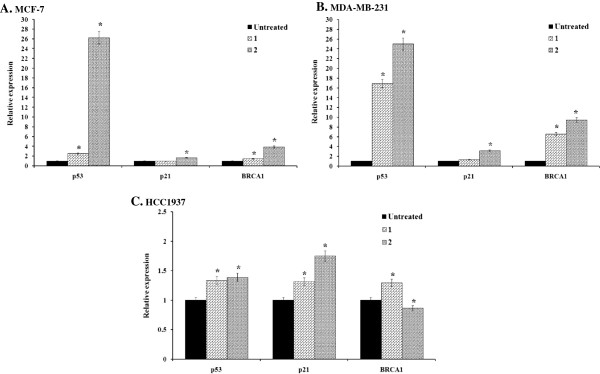
mRNA determination. MCF-7 (A), MDA-MB-231 (B), and HCC1937 (C) cells were treated with appropriate IC50 concentrations of 1 or 2 (Table 1) for 24 h. The transcript abundance of the genes was assessed by a real-time quantitative RT-PCR, normalized with the expression of β-Actin and relative to the expression of untreated control cells. Data were analyzed according to the 2-∆∆CT method [27]. All experiments were performed in triplicate.