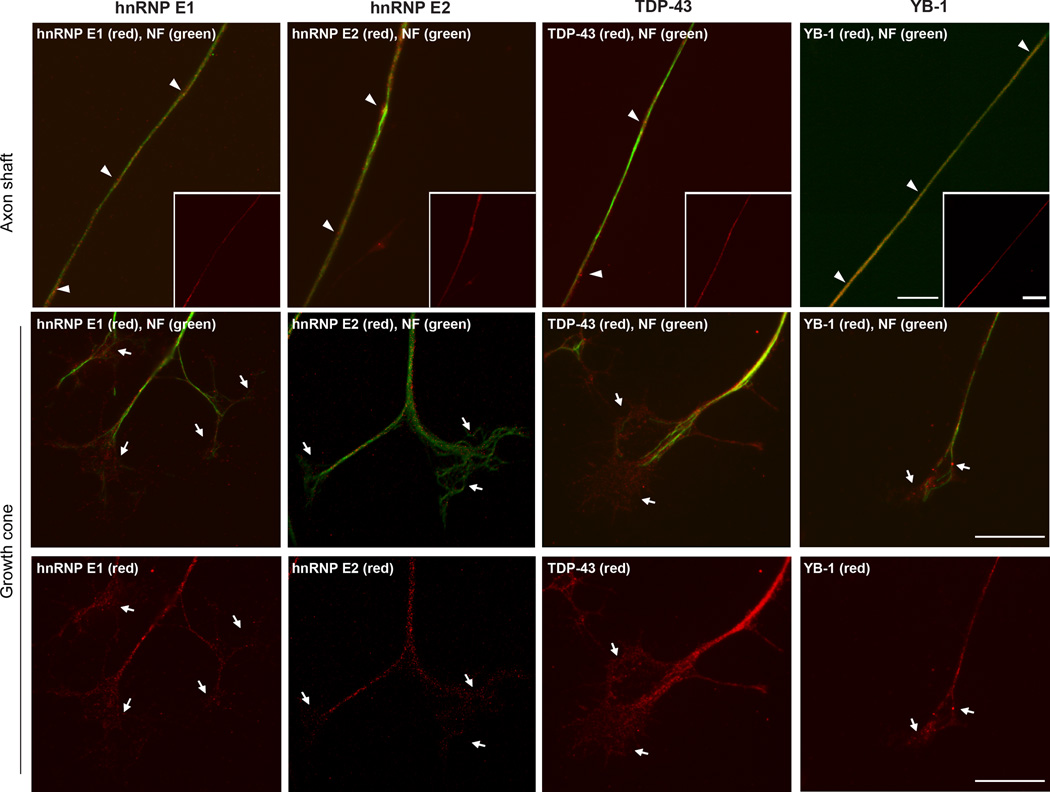
Figure 1. Axonal localization of RNA Binding Proteins.
Representative fluorescent micrographs for cultures of adult DRG neurons that were immunostained with antibodies to the indicated RNA binding proteins (red) and neurofilament (green) are shown. The top row shows axon shaft (arrow heads) with red/green channels merged in the main panel and red channel only in the inset panel. Middle and bottom rows show growth cones (arrows) as red/green merged channels in the middle row and red only channels merged in the bottom row as indicated. hnRNP E1, hnRNP E2, TDP-43 and YB-1 all show localization to the axons with granular profiles. TDP-43 and YB-1 appear somewhat more concentrated in the growth cones compared with the 2 hnRNPs [scale bar = 10 µm].

