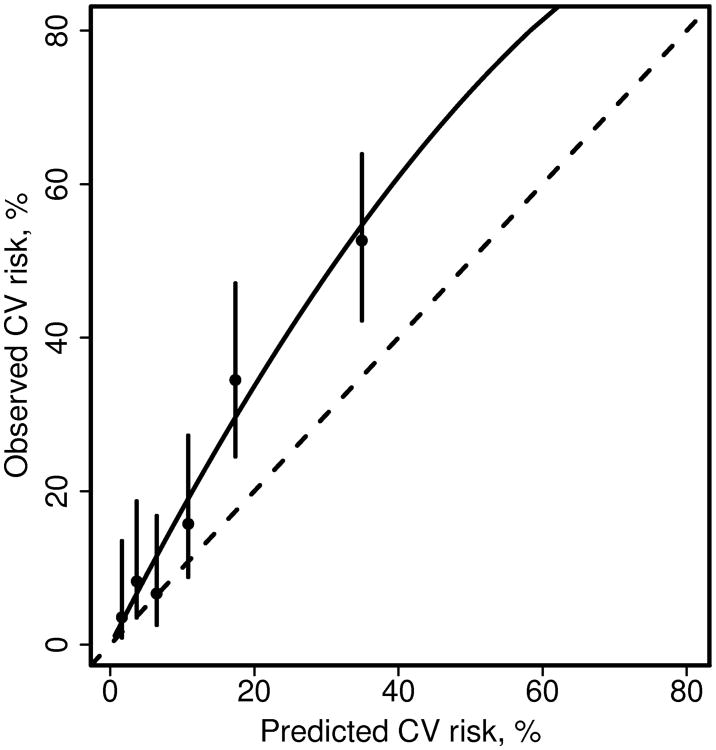
Figure 1.
Calibration plot comparing predicted and observed cardiovascular (CV) disease risk for patients with rheumatoid arthritis. Patients were grouped into 6 groups of predicted risk (obtained from the Framingham risk score). Observed 10 year risk of CV events for each group of patients and confidence intervals were estimated from a Poisson regression model including covariates for each group (model 3). The dashed line is the identity line. The solid line was estimated from a Poisson regression model including only an intercept with an offset for the log of the expected number of events (model 1).

