
Figure 1. Maps of group differences in morphological measures of the cerebral surface.
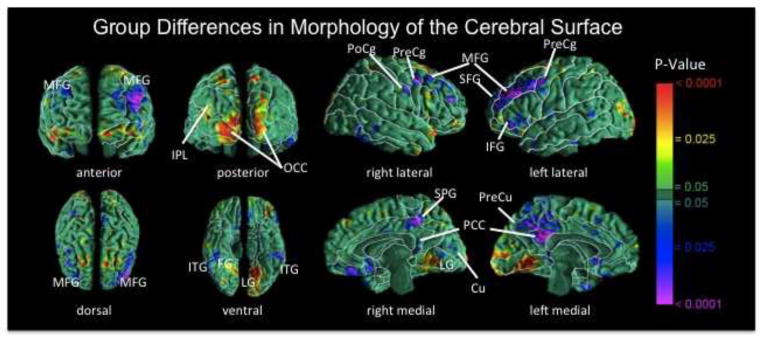
The signed euclidean distances between points on the surfaces of the cortex for each participant and corresponding points on a template brain were compared statistically between the BN and control groups using linear regression at each voxel on the surface while covarying for age. Warm colors indicate significantly larger distances (local enlargements, outward deformations) in the BN vs. control group; cool colors (blue and purple) indicate reduced distances (local indentations, inward deformations) in the BN vs. control group. The color bar indicates P values corrected for multiple comparisons using a false discovery rate P < 0.05. BN group brains were significantly reduced bilaterally in medial frontal and precentral gyri, in superior and inferior frontal gyri of the left hemisphere, the postcentral gyrus of right hemisphere, and bilateral temporoparietal areas (P’s = 0.01 to 0.0001). MFG, medial frontal gyrus; PoCg, postcentral gyrus; PreCg, precentral gyrus; IFG, inferior frontal gyrus; SFG, superior frontal gyrus; IPL, inferior parietal lobule; OCC, occipital cortex; ITG, inferior temporal gyrus; FG, fusiform gyrus; SPG, superior parietal gyrus; PCC, posterior cingulate cortex; Cu, cuneus; PreCu, precuneus; LG, lingual gyrus.