
Figure 2. Group differences in surface measures of white matter.
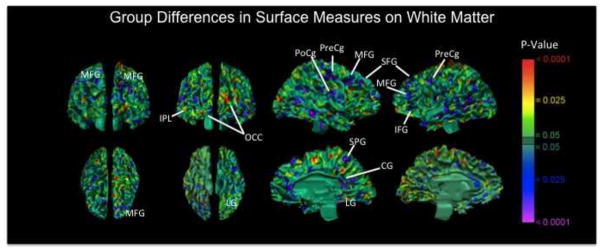
Shown here are color-coded maps comparing surface distances of white matter at each corresponding voxel of each participant’s brain from the corresponding voxel of the white matter surface in the template brain. The pattern of differences across groups is similar to the pattern of statistical significance of those differences depicted in the maps of P values comparing surface measures on the cerebral surface across groups (Fig. 1), particularly in frontal regions on the lateral surface. These analyses suggest that the observed regional reductions of the cerebral surface in the BN group derived primarily from reductions in underlying white matter.