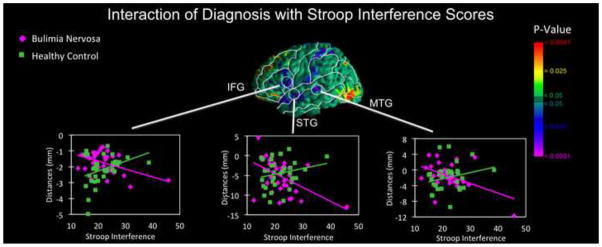
Figure 5. Correlations of surface morphology with Stroop interference scores in the BN vs. control groups.

Surface distances (in mm from the corresponding point on the surface of the template brain), adjusted for age, are plotted on the y axis. Reductions in the left inferior frontal gyrus correlated inversely with Stroop interference scores in the participants with BN (r = −0.7), producing significant diagnosis × stroop interactions. Scatterplots suggest that greater interference was associated with greater reductions of these regions in the BN group.
