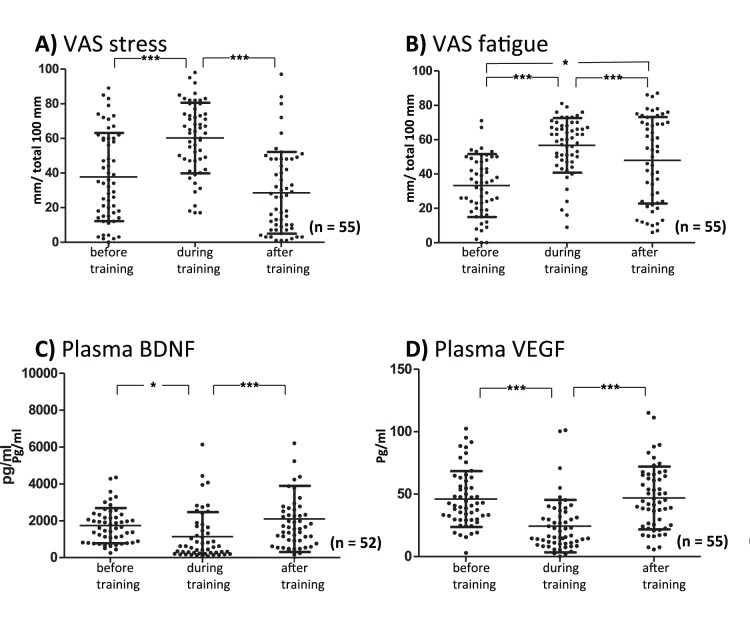
Figure 2. Stress (A; F2,54 = 34.8) and fatigue (B; F2,54 = 21.5) rated on the visual analog scale (VAS) are plotted before, during, and after training.
The results of plasma brain-derived neurotrophic factor (BDNF, C; F2,51 = 7.8) and vascular endothelial growth factor (VEGF, D; F2,54 = 20.7) are plotted before, during, and after training. Significant differences between groups are indicated as *p<0.05, **p<0.01, and ***p<0.001 using repeated one-way ANOVA followed by post hoc Tukey’s multiple comparison tests.

