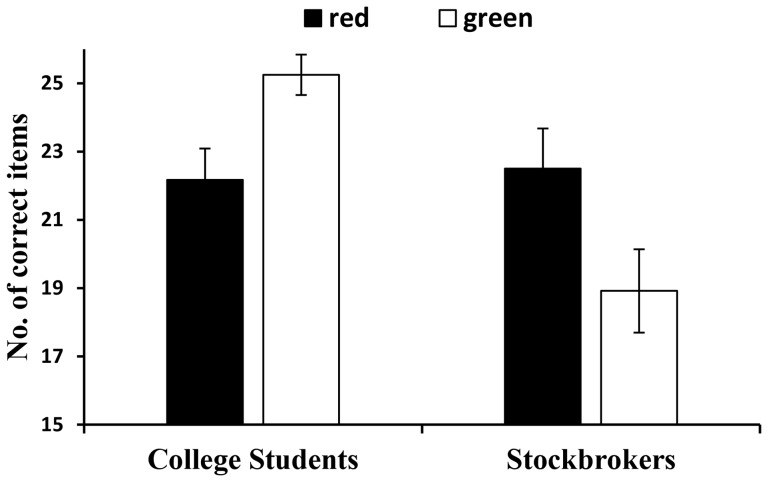
Figure 1. The effect of color on performance on Raven’s Standard Progressive Matrices The college students in the red group (n = 12) performed worse than did those in the green group (n = 12).
Conversely, the stockbrokers in the red group (n = 12) performed better than did those in the green group (n = 12). Error bars indicate standard error of test scores.

