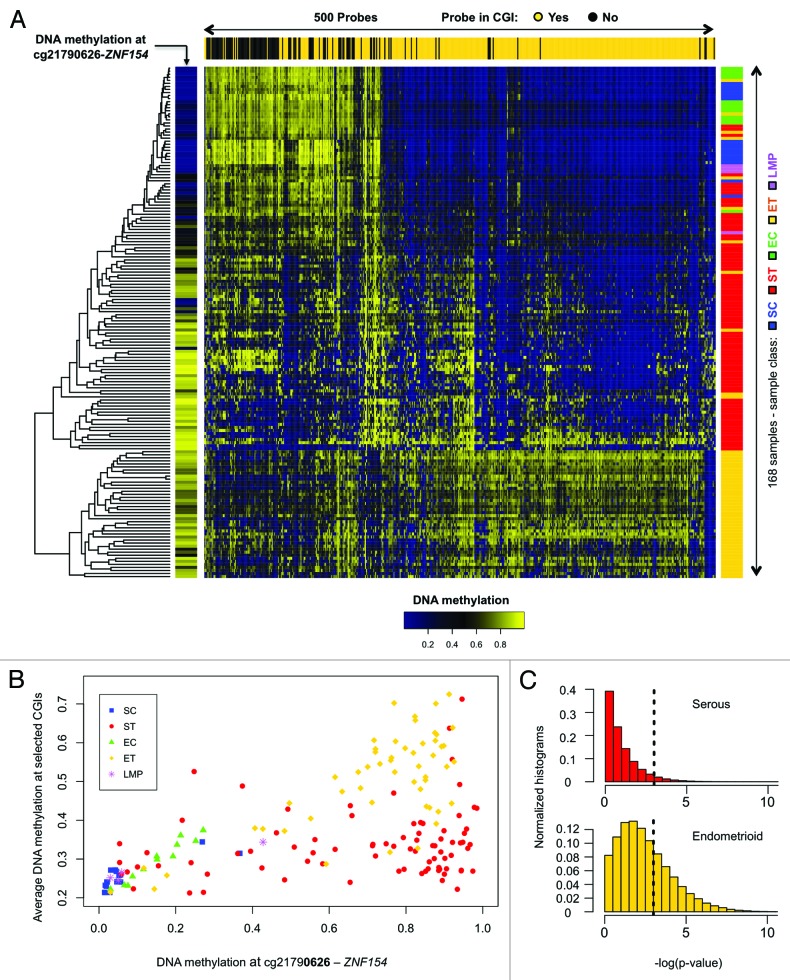
Figure 2. Methylation at the ZNF154 promoter is correlated with widespread methylation of CpG islands in endometrioid tumors. (A) Hierarchical clustering of all our ovarian and endometrial cancer samples using the 500 probes with the highest variance in methylation, selected as in Kolbe et al.25 The heat map shows levels of methylation as β values associated with each pair of probe (columns) and sample (rows). Top horizontal color bar shows which of the probes are located within CpG islands. The vertical color bar on the left shows the level of methylation at cg21790626-ZNF154 for each individual sample. The vertical color bar on the right shows the sample class, including serous controls (SC), serous tumors (ST), endometrioid controls (EC), endometrioid tumors (ET) and papillary serous tumors of low malignant potential (LMP). (B) DNA methylation at cg21790626-ZNF154 vs. average DNA methylation at the set of 380 probes from the top panel that are located within CpG islands. Each point in the plot corresponds to an individual sample. (C) Distribution of P values for Spearman correlation coefficients between DNA methylation at cg21790626-ZNF154 and average methylation at sets of 380 probes that were randomly selected in CpG islands across the entire genome. Each of the two histograms shows results for one million random choices of probe sets.

An official website of the United States government
Here's how you know
Official websites use .gov
A
.gov website belongs to an official
government organization in the United States.
Secure .gov websites use HTTPS
A lock (
) or https:// means you've safely
connected to the .gov website. Share sensitive
information only on official, secure websites.
