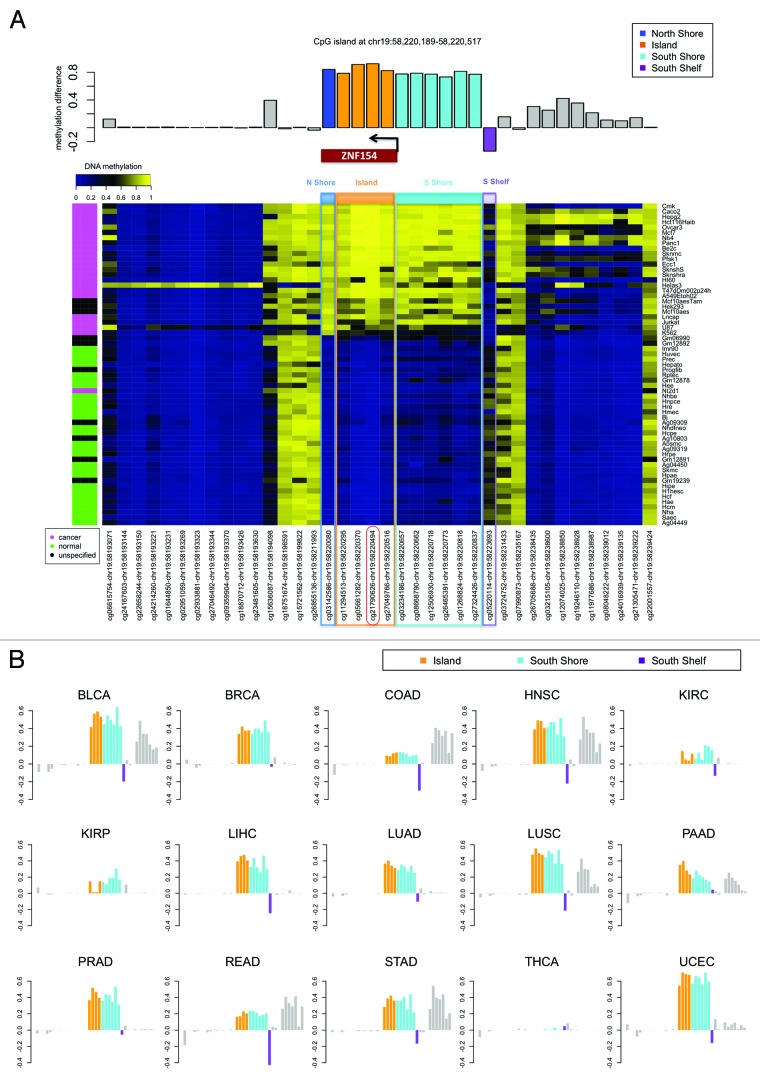
Figure 6. Methylation near the CpG island at chr19:58 220 189–-58 220 517, which is located at the promoter of gene ZNF154 and contains probe cg21790626 (highlighted in red). (A) Methylation levels in ENCODE cell lines depicted in the heat map show β values for each pair of probe (columns) and cell line (rows). Rows are ordered according to decreasing values of methylation at cg21790626 from top to bottom. The color side bar on the left shows cancer (magenta), normal (green), and unspecified (black) cell line annotations as provided by ENCODE. Probes located within the north shore (blue), island (orange), south shore (cyan), and south shelf (purple) are highlighted. The bar plot above the heat map shows the difference in median methylation in cancer cell lines minus median methylation in normal cell lines for each individual probe. (B) Difference in median methylation in tumors vs. controls at probes neighboring CpG island chr19:58 220 189–58 220 517 in different cancer types from TCGA. Ovarian cancer is excluded because no data from the Illumina 450K platform were available from TCGA at the time of our analysis. The color notation and the probe locations are the same as in the top panel. Positive values correspond to hypermethylation in tumors. Bars corresponding to probes that were marked as “not available” (NA) in level 3 data from TCGA (including the probe located within the north shore from panel A) are shown as empty horizontal gaps.

An official website of the United States government
Here's how you know
Official websites use .gov
A
.gov website belongs to an official
government organization in the United States.
Secure .gov websites use HTTPS
A lock (
) or https:// means you've safely
connected to the .gov website. Share sensitive
information only on official, secure websites.
