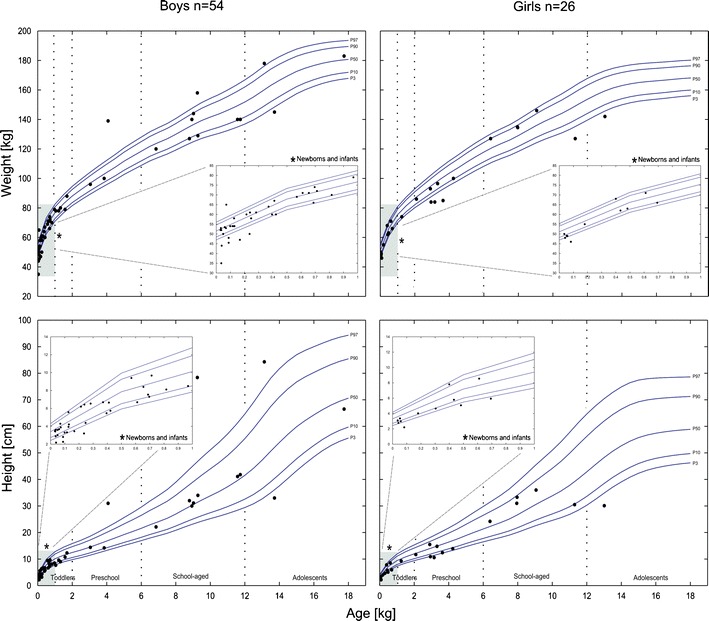
Fig. 1.

The height and/or weight (dots) of each of the 80 children (boys, n = 54 (right); girls, n = 26 (left)); the observed population originally exposed to sotalol. In addition, lines show pediatric age- and gender-specific percentiles (3rd, 10th, 50th, 90th, and 97th), which represent the normal values of a German representative population (61). Insets show the demographics of the segment from birth to the end of the first year to highlight the values of newborns and infants
