
Fig. 4.
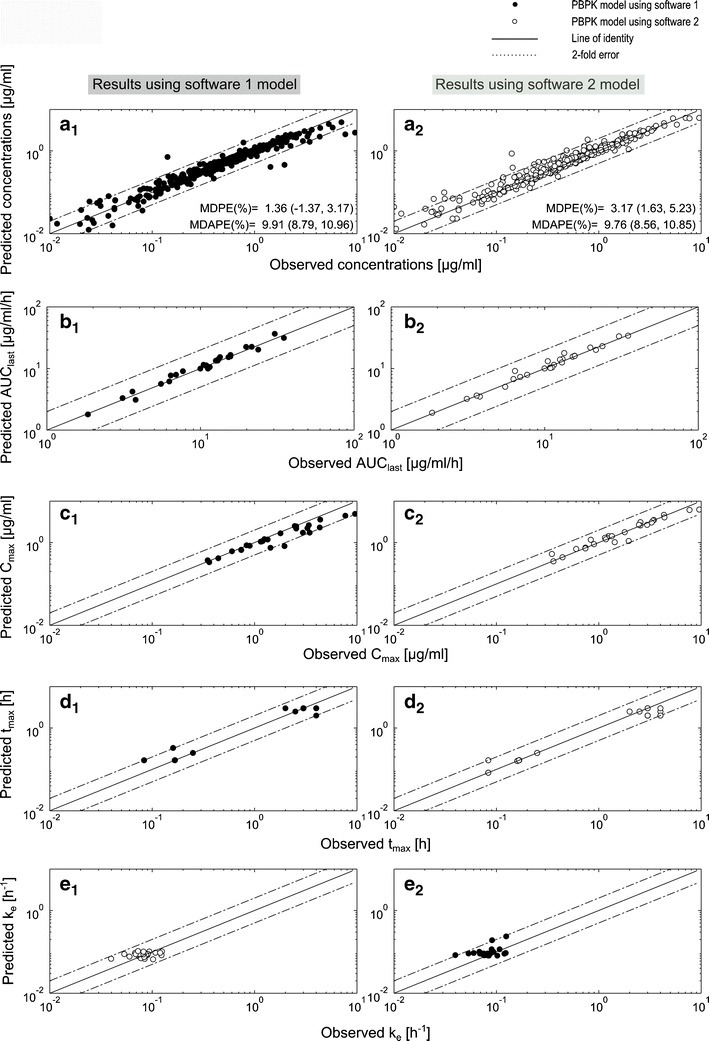
Goodness of fit plots for simulations of adult data by both sotalol PBPK models. a Predicted vs. observed concentrations plot, b–e predicted vs. observed AUClast, C max, t max, and k e plots. Results are obtained by using software 1 (SIMCYP®, left column, filled circles) and software 2 (PK-SIM®, right column, empty circles). Line, line of unity; dashed lines, twofold error range; MDPE median percentage error (95% CI), MDAPE median absolute percentage error (95% CI)