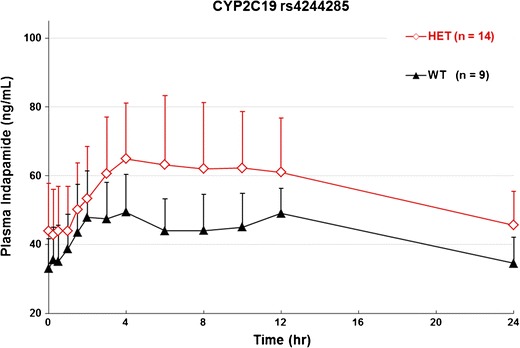
Fig. 2.

Steady-state mean plasma concentration-time profile according to genotypes for SNP rs4244285 after administration of the last dose of indapamide 1.5 mg at 216 h. HOMO homozygous, HET heterozygous, WT wild type, n sample size. Data are mean ± SD at specific times
