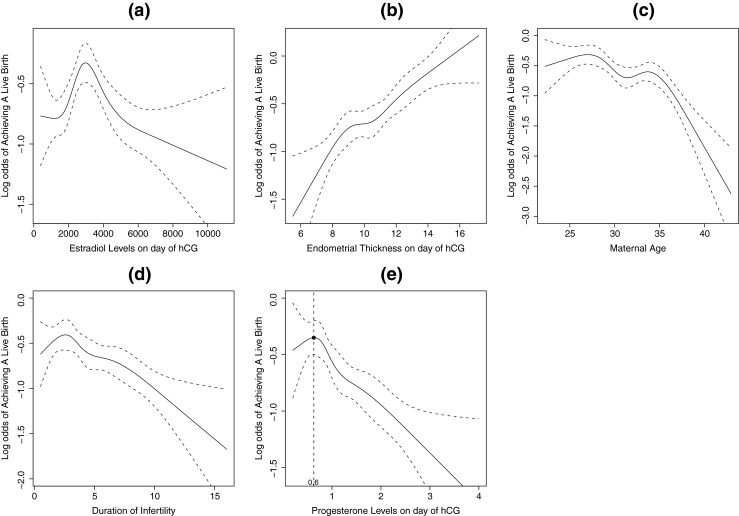
Fig. 1.

a Restricted cubic spline curve and 95 % confidence levels between oestradiol level on the day of hCG administration and log odds of live birth; b Restricted cubic spline curve and 95 % confidence levels between endometrial thickness on the day of hCG administration and log odds of live birth; c Restricted cubic spline curve and 95 % confidence levels between maternal age and log odds of live birth; d Restricted cubic spline curve and 95 % confidence levels between duration of infertility and log odds of live birth; e Restricted cubic spline curve and 95 % confidence levels between progesterone level on the day of hCG administration and log odds of live birth; the threshold point at 0.6 ng/ml is plotted
