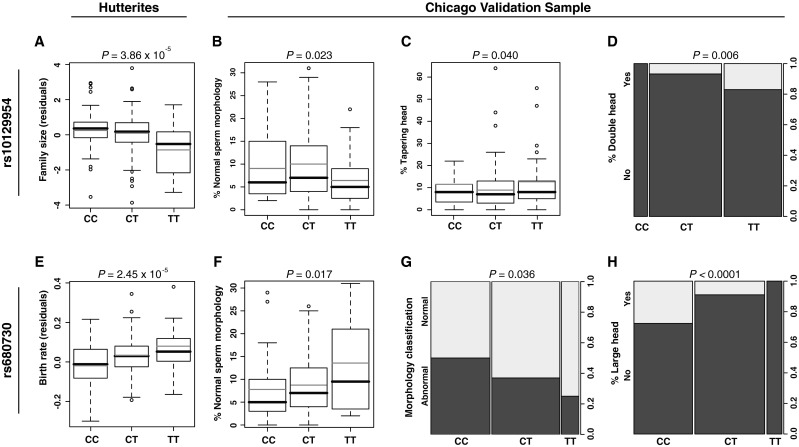
Fig. 2.

Effects of the associated SNPs, rs10129954 (a–d) and rs680730 (e–h), on fertility measures in Hutterite men (from Kosova et al. [6]) and sperm morphology in Chicago sample. The boxplots show the first and third quartiles; the whiskers extend to the minimum and maximum values, excluding the outliers. Black horizontal lines show the median, and grey horizontal lines show the mean value within each genotype group. Column plots in panels d, g and h show the presence or absence of each abnormality in the Chicago sample, with the proportion of men is shown on the right y-axis. P-values correspond to the single-locus SNP-specific GWAS P-value in the Hutterite men [6], and empirical P-values obtained after 10,000 permutations in the Chicago men. FS family size; BR birth rate
