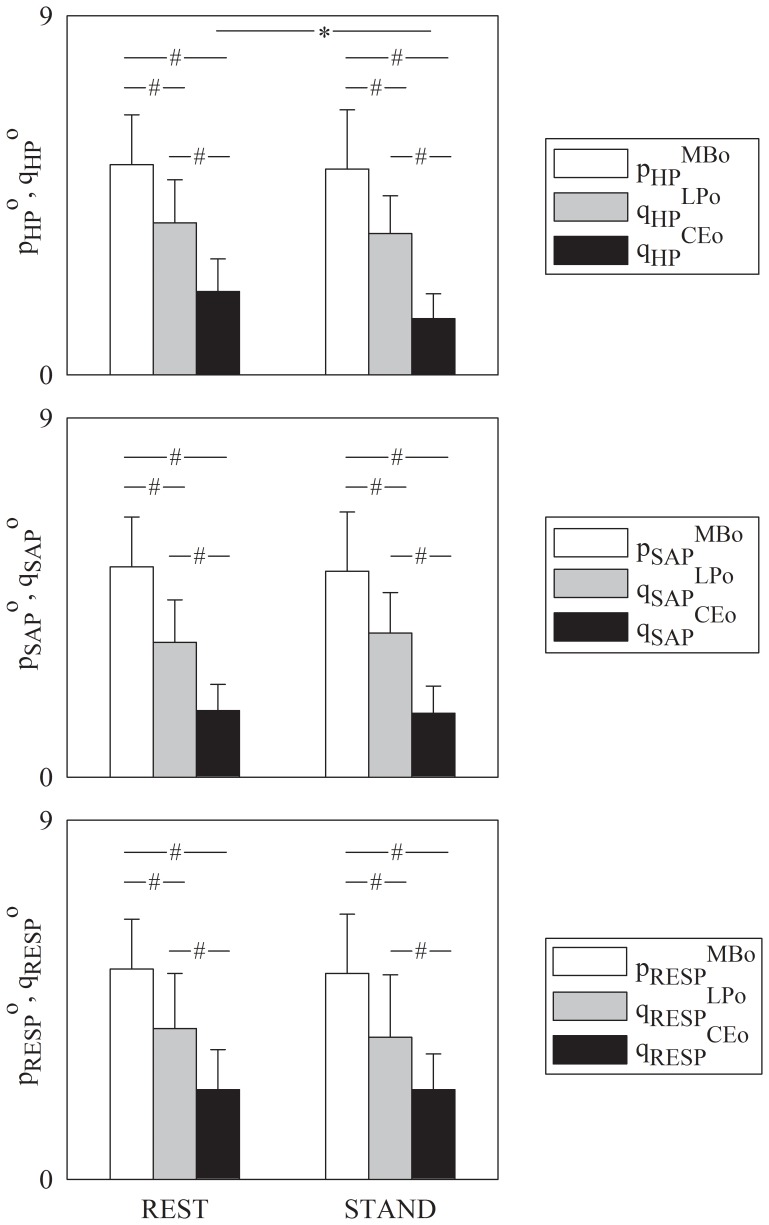
Figure 1. Comparison of the MB, LP and CE approaches.
Grouped bar-graphs show the mean (plus standard deviation) of the optimal model order, po, leading to the minimum of the Akaike figure of merit according to the MB approach (white bar) and of the number of components, qo, utilized to build the optimal multivariate embedding space leading to smallest unpredictability according to the LP method (gray bar) and to the minimal amount of information according to the CE technique (black bar). po and qo are shown as a function of the experimental condition (i.e. REST and STAND) and values are pooled together regardless of age. The designated effect series are HP, SAP and RESP in (a), (b) and (c) respectively. The symbols # indicates a significant difference with p<0.05 within the same experimental condition (i.e. REST or STAND) while varying the method. The symbols * indicates a significant difference with p<0.05 within the method while varying the experimental condition.

