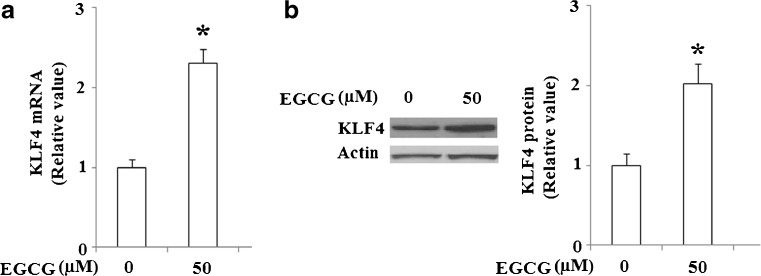
Fig. 12.
EGCG elevated the expression of KLF4. Hep G2 cells were treated by 50 μM EGCG for 48 h and a qRT-PCR analysis revealed that mRNA levels of KLF4 increased in response to EGCG treatment (*p < 0.01 vs. untreated control, n = 4); b western blot analysis revealed that protein levels of KLF4 increased in response to EGCG treatment (*p < 0.01 vs. untreated control, n = 4)

