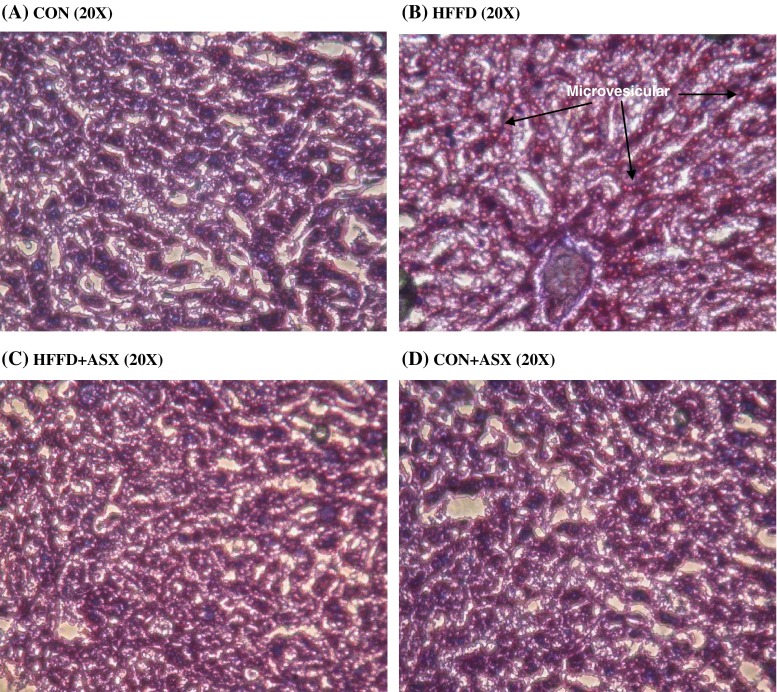
Fig. 2.
Representative images of frozen liver sections stained with Oil red O (×20) of experimental animals. Section from CON group shows negligible red staining (a). HFFD fed mice liver (b) shows increased deposition of lipids. Red stained areas (arrows) indicate lipid deposition. Liver section of HFFD + ASX (c) shows reduced red staining indicating reduced lipid deposition as compared to HFFD. CON + ASX group (d) shows negligible staining similar to that of CON group (a)

