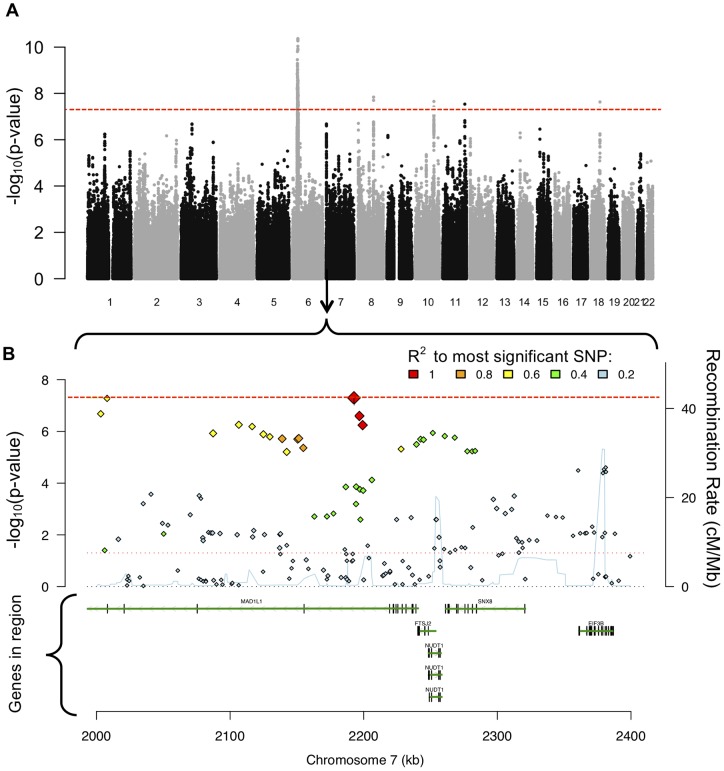
Figure 1. Manhattan plots illustrating data use decisions in pathway analyses.
Figure 1 utilizes a Manhattan plot of 22 chromosomes (A) and a detailed Manhattan plot for a region of chromosome 7 (B) to illustrate differences in pathway analytic methods. One major distinction among pathway analysis methods designed for GWAS data concerns the use of raw data (i.e. individual level genotypes) versus summary statistics (i.e. p-value, odds ratios, betas, etc. per SNP). For example, the paper recently published by Goudriaan et al (2013) used raw genotype data. In contrast, the four methods used in this report all use SNP-level summary statistics as input data. Figure 1A is a 'Manhattan plot, in which each point represents one SNP. The x-axis denotes chromosomal position and the y-axis denotes significance of each SNP's association to the phenotype (units of -log10p-value). The horizontal red line denotes genome-wide significance (p<5×10⁻⁸). In Figure 1B, a section of the Manhattan plot on chromosome 7 is expanded, and the location of genes is given in the lower portion of section 1B. As seen in 1B, individual genes may contain many SNPs (colored diamonds in figure). Three of the pathway analytic methods used in this report use a ‘best SNP per gene/region’ approach, meaning that they ‘count’ only the most significant SNP in a gene or region of interest (methods MAGENTA, ALIGATOR, and INRICH). In contrast, Set Screen utilizes information from all SNPs within a gene or region of interest in the calculation of pathway-level statistics. Another aspect of the design of pathway analyses is illustrated in 1B: correlation among SNPs. Due to the haplotype structure of chromosomes, many genetic variants are correlated with one another, and are said to be in ‘linkage disequilibrium’ or ‘LD’. Thus, each method used in this report has analytic procedures for handling LD, so that correlated signals are not inappropriately counted multiple times. As stated in the text, correlation among SNPs is so extensive in the HLA region of chromosome 6, that pathway analytic methods currently exclude this region from analysis. In the past, failure to exclude the HLA from pathway analyses led to the reporting of spurious associations. Finally, we note that assigning of SNPs to genes is an imprecise task. Two complications are overlapping genes and correlated variants that may span many genes. A more daunting challenge is capturing the regulatory elements that impact genes. Such elements may be located far from genes, sometimes even on different chromosomes. Future developments in pathway analytic methods will likely make use of information about tissue and gene-specific regulatory elements (e.g. derived from the ENCODE project), but such information is not currently implemented in these pathway analytic methods.

