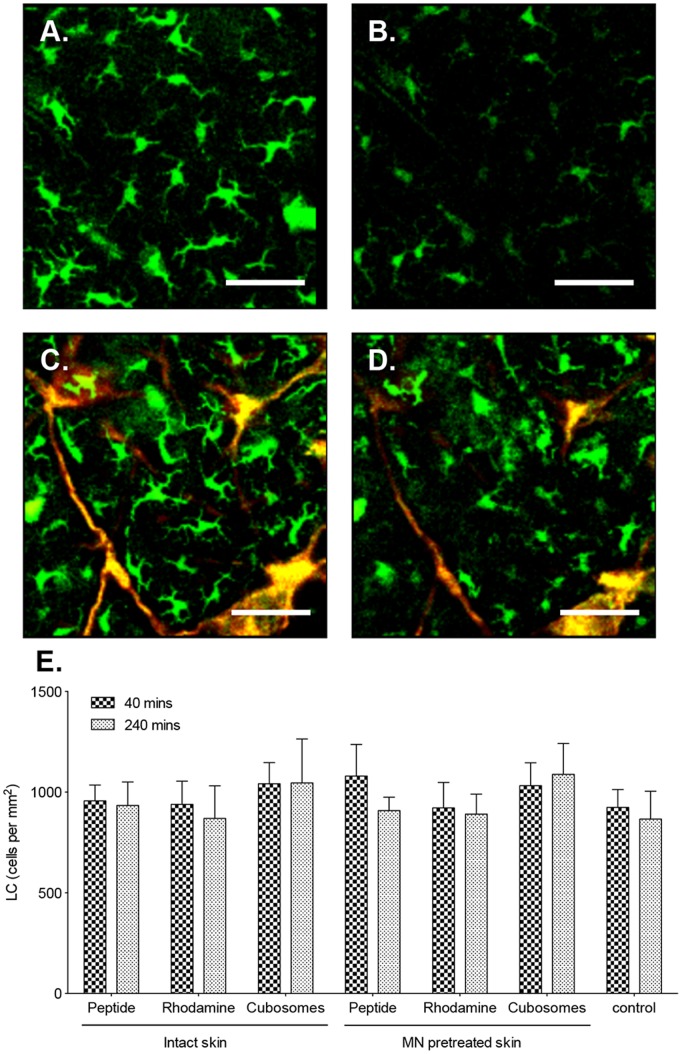
Figure 2. Impact of TCI on LC.
Two-photon microscopy (2 PM) visualization of the distribution of LC (green) and formulation (red) in the epidermis of unimmunized mice (A, B) or following application of (C, D) TMR-SIINFEKL-loaded cubosomes for 40 min (A, C) and 240 min (B, D). Images are representative of groups of three mice. Scale bar is 100 µm. (E) The number of LC/mm2 in the epidermis in untreated controls (control) or following the application of aqueous TMR-SIINFEKL (peptide), rhodamine-labeled cubosomes (rhodamine) and TMR-SIINFEKL-loaded cubosomes (cubosomes) in the presence and absence of MN for 40 and 240 min. Cells were quantified from three randomised images from one mouse per group in three independent experiments. Data presented are the mean+SD.

