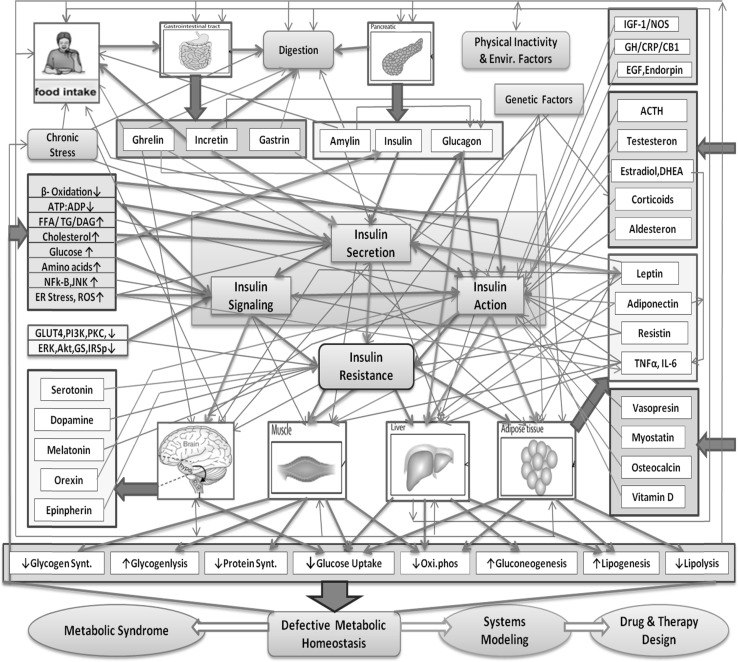
Fig. 2.
A systemic map of the complex nature of insulin resistance and defective metabolic homeostasis. The factors affecting insulin secretion, signaling and action in liver, muscle, adipose and brain are shown in the figure. The bold lines represent the modeled interactions. The green and red lines show positive and negative effects of corresponding factors on insulin, respectively, whereas the blue lines show the general flow of the processes. (Color figure online)

