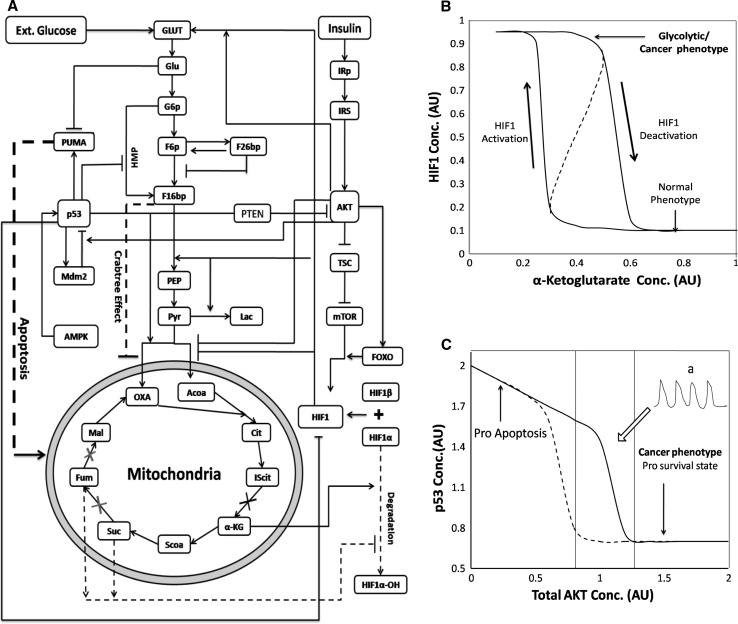
Fig. 4.
a Integrated network of metabolic and signaling pathways involved in warberg effect in cancerous cells. The network consists of the interplay of growth factor (insulin) signalling, p53-Mdm2-PTEN signaling and the HIF1 signalling that regulates central metabolism. The apoptosis, crab-tree effect and the degradation of HIF1 by metabolites is shown by dotted lines. b The dose response curve for a submodule of the integrate network for HIF1 with respect to varying α-ketoglutarate concentration. The system elicit bistability with two distinct states i.e. glycolytic phenotype and normal TCA functioning state. c The dose response curve for another submodule of the integrate network for p53 activation with respect to total Akt concentration. Due to mutual inhibitory loop the AKT-p53 signaling system also elicit bistability with respect to varying AKT concentrations leading to prosurvival/cancerous phenotype and pro apoptotic states. In the normal range of Akt, p53 shows oscillatory behaviour (curve ‘a’) in the dynamic scale which enables the cell to frequently decide between survival and apoptotic cellular fate

