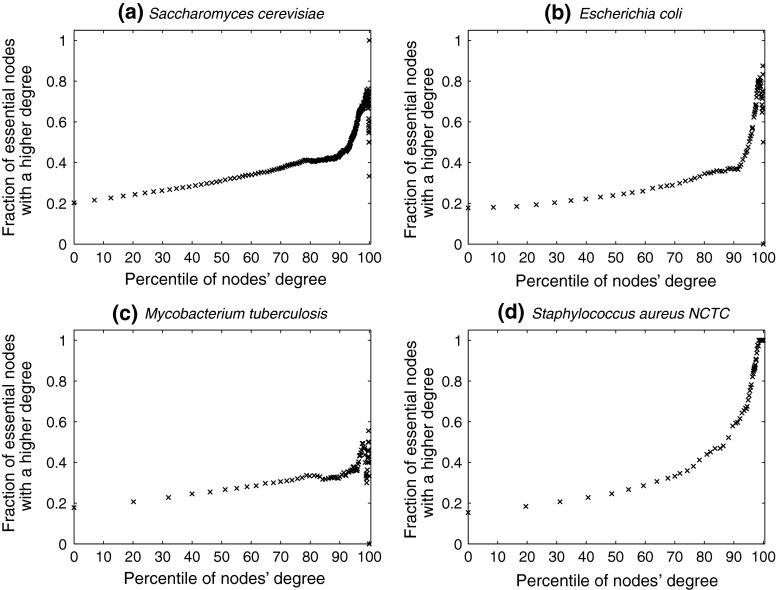
Fig. 1.
Variation in fraction of essential nodes, with increase in degree. The horizontal axis represents increasing node degrees, indicated as percentiles (x), while the vertical axis indicates the fraction of essential nodes in  , the set of nodes with degrees in the xth percentile and above. For simplicity, four example organisms are shown: a
S. cerevisiae, b
E. coli, c
S. aureus NCTC and d
M. tuberculosis. To illustrate, in panel (d), M.
tuberculosis, about 31 % the nodes with the highest 30 % of degrees (nodes in
  ) are essential. This increases to 33 % in
  . In panel (a), S. cerevisiae, about 37 % of the nodes in
  are essential, which rises to 44 % in
  . For further details, see text

