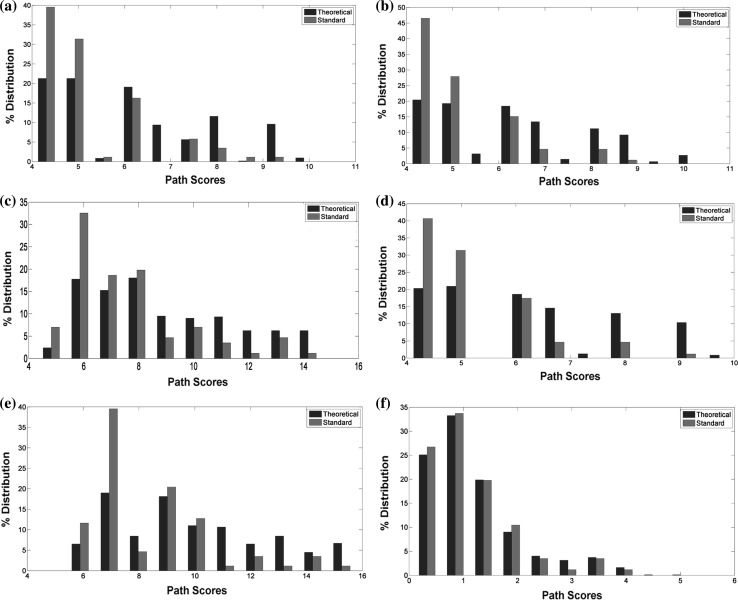
Fig. 2.
Percentage distribution of the path scores for the different weighting schemes, a sc1, b sc2, c sc3, d sc4, e sc5 and f sc6. Red bar represents the 86 RPs (Reference/Standard) while the blue bar represent 1,066 TPs (Theoretical). Percentage distribution was calculated to normalize the discrepancy of the number of data points in the two sets. (Color figure online)

