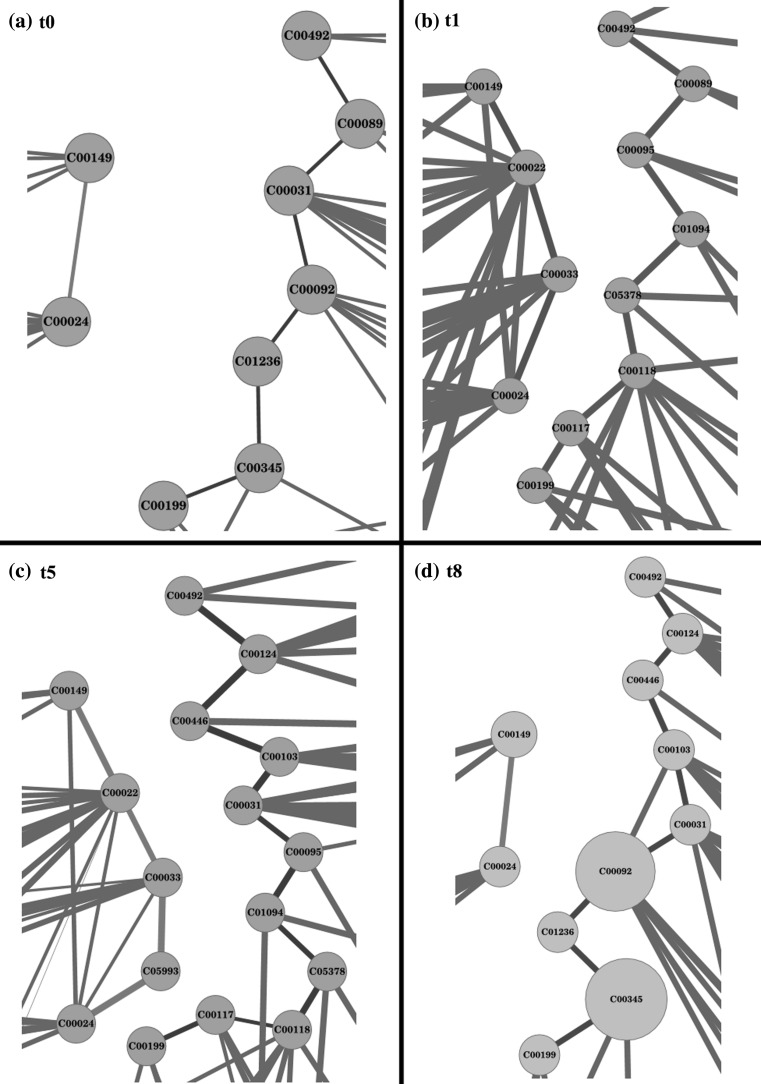
Fig. 4.
Illustration of the different metabolic routes taken up by the network at different time points, highlighting the change in dynamics of the cell. Paths for two pairs of nodes are shown in different colours at a time point t0, b time point t2, c time point t5 and d time point t8, highlighting the different phases of the system. (Color figure online)

