
Figure 2. Comparison of cell disruption techniques to increase yields.
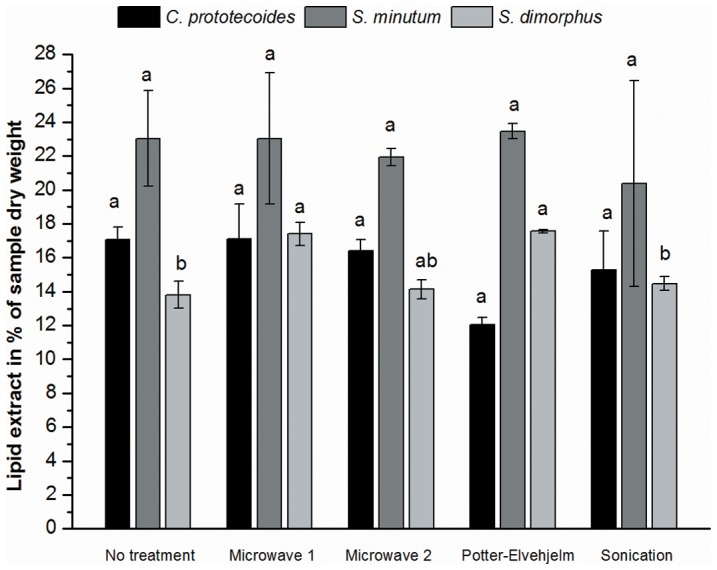
Bars show gravimetric yields of total lipids extracted by the single-step procedure from different algal species. Yields are expressed as a percentage of the algal sample in dry weight (mean ± SE, n = 2; experiment 1). Different letters above bars of the same alga indicate a significant difference at α = 0.05.