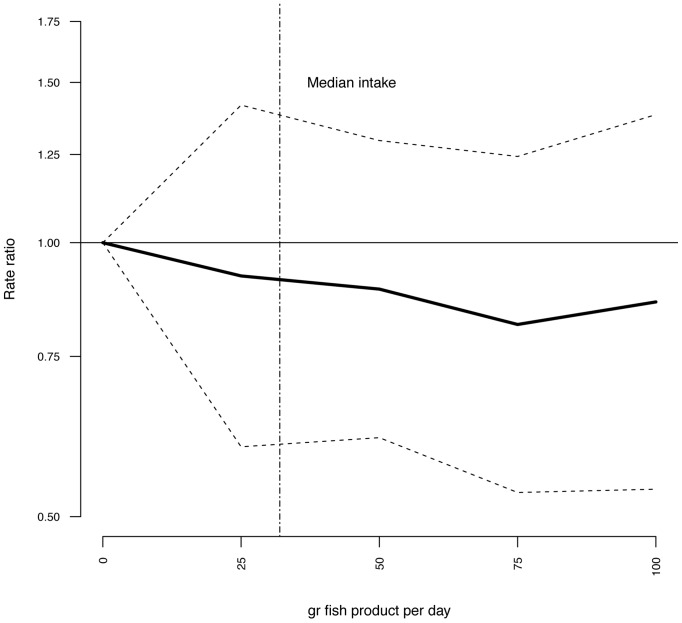
Figure 3. Risk ratios (RR) and 95% CI by fish product consumption.
RRs are indicated by the solid line and the 95% CI by the dashed horizontal lines. Numbers are adjusted for BMI, hypertension, smoking status, age and physical activity. Median intake of fish products in the study group is indicated by the dashed vertical line.

