
Figure 3. Time-dependency of senescence marker protein expression after TCDD exposure.
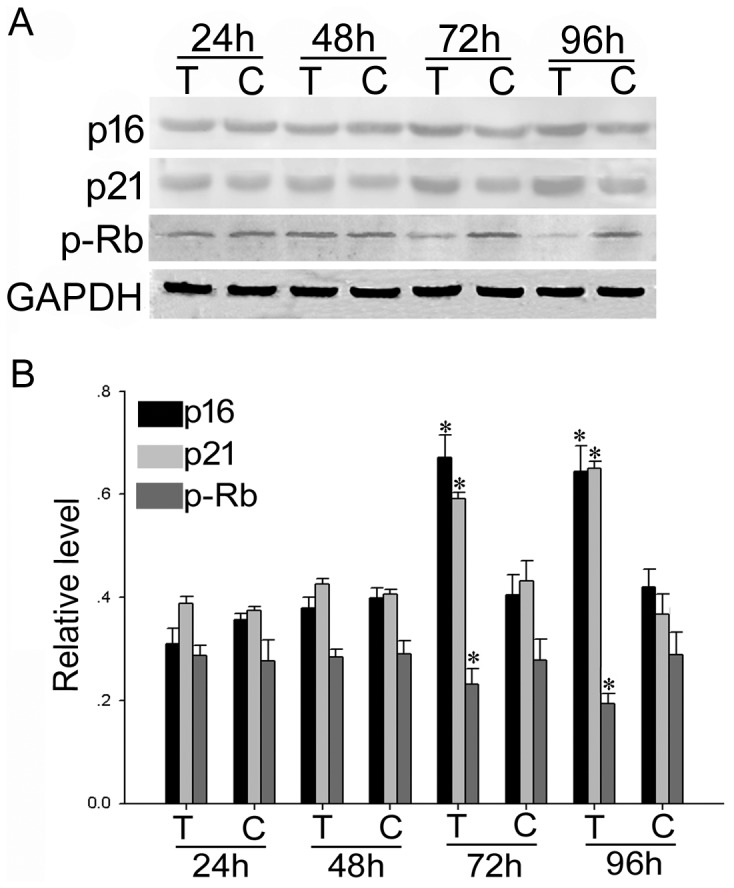
(A) PC12 cells were exposed to 50 nM TCDD for 24, 48, 72 or 96 h and then harvested for western blot analyses using anti-p16, anti-p21 and anti-p-Rb antibodies. T, TCDD-treated cells; C, control group. (B) Quantitative analysis of the intensity of protein expression relative to GAPDH in the indicated groups (*, # and ∧ p<0.05, statistically significant difference from the control group).