
Figure 8. Selectivity and sparseness in a random network with weak synapses.
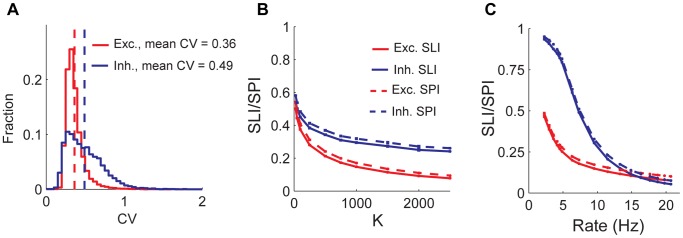
A) Distribution of ISI CVs for excitatory (red) and inhibitory (blue) populations. Vertical dashed lines show population means. Excitatory population fires 9.6 Hz while the inhibitory population fires at 9.1 Hz. B) Population averaged SLI (solid lines) and stimulus averaged SPI (dashed lines) as a function of  . Excitatory population firing rate is kept fixed at 10 Hz by adjusting the mean input firing rate. C) Population averaged SLI (solid lines) and stimulus averaged SPI (dashed lines) as a function of excitatory population rate. For our simulations with weak synapses, synaptic coupling parameters were scaled by
  .
.