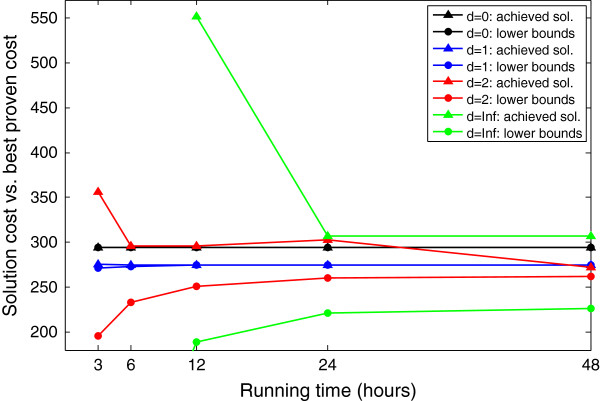
Figure 3.
Dependency of the MKL algorithm performance on the heuristic filtering. This figure compares the performance of the MKL algorithm with respect to different values of the heuristic data reduction parameter d and when setting different limits on the running time. For each value of d (0, 1, 2 or no heuristic filtering), two plots with the same color are displayed: the top plot (triangle symbols) shows the cost of the achieved solution after the specified number of hours (or less); the bottom plot (circles) shows the best proven theoretical lower bound on an optimal solution as reported by the same execution. Note that for d = 0 these two (black) plots fully coincide.

