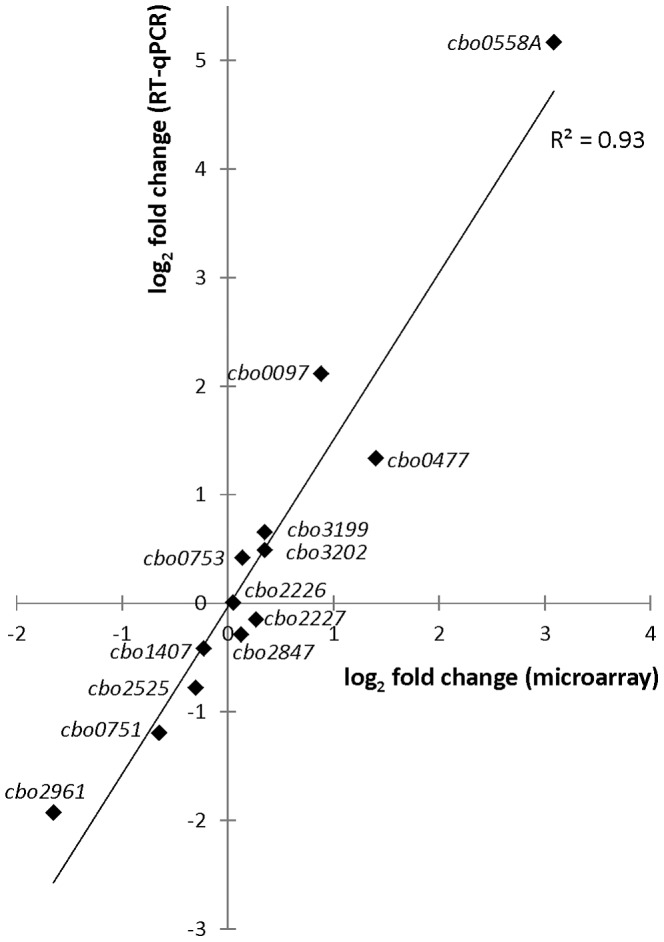
Figure 2. Confirmation of DNA microarray results with quantitative real-time reverse-transcription PCR (RT-qPCR).

Log2 fold changes of transcript levels measured with DNA microarrays (x-axis) and RT-qPCR (y-axis) in C. botulinum ATCC 3502 cultures 1 h after temperature downshift from 37°C to 15°C. 16S rrn transcript levels were used as a normalization reference in the RT-qPCR. Linear regression analysis showed an R2 correlation value of 0.93 between the microarray and RT-qPCR transcription fold change results.
