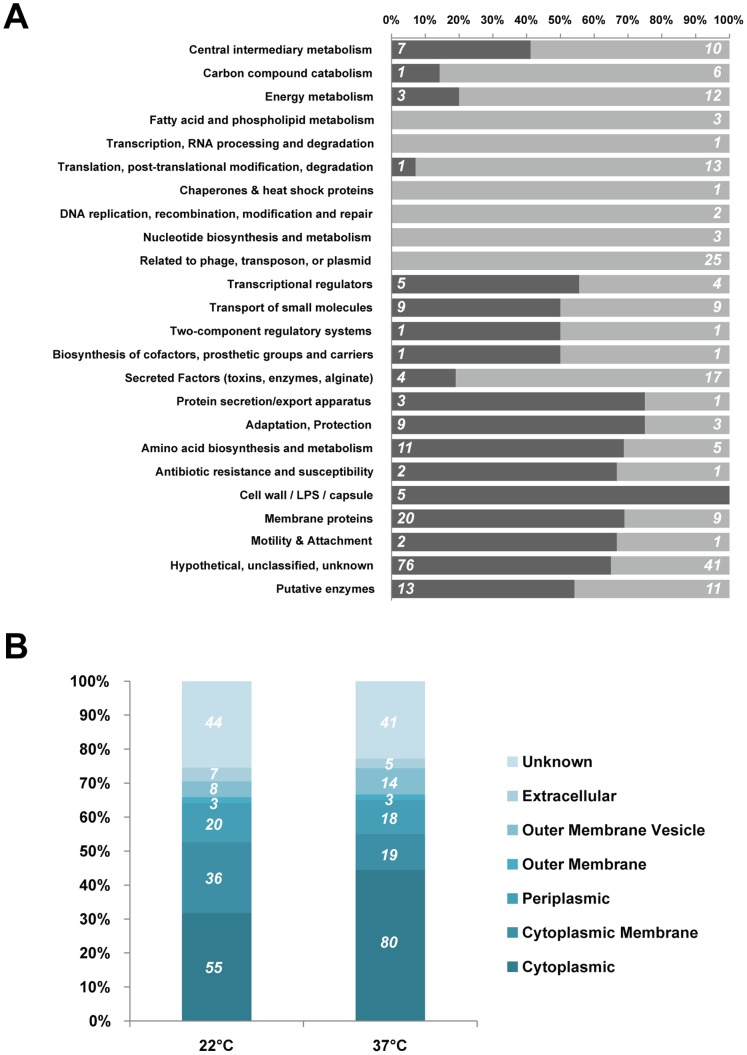
Figure 1. Functional analysis of differential gene expression at 22°C and 37°C.
A. Classifications of the genes showing a significant differential expression in microarray analysis at 22°C or 37°C based on PseudoCAP function class assignments [28]. The percentage of genes down-regulated in PAO1 at 22°C compared to 37°C is indicated in dark grey and the percentage of the genes up-regulated is indicated in light grey. The absolute number of genes differentially regulated under these conditions in each class is indicated on the bars. B. Subcellular localization of the products of the genes differentially regulated at 22°C and 37°C. Data represent the primary localization assignment of the gene products based on PAO1 genome annotation of the Pseudomonas Genome Database (www.pseudomonas.com) [20]. Gene products of unknown location were removed from this analysis.

