
Figure 2. RT-qPCR analysis of temperature dysregulated genes.
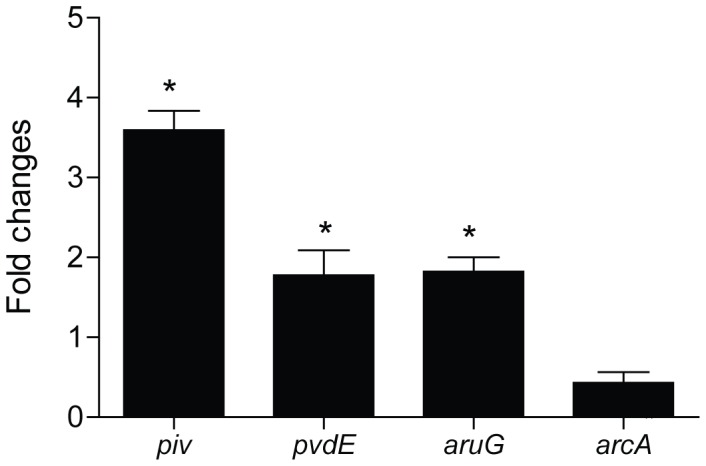
Analysis of the expression of control genes by RT-qPCR to validate microarray analysis. Each gene was analyzed in triplicate and data are represented as fold changes at 22°C compared to 37°C. Data were analyzed using a sample two-tailed t-test. Genes significantly dysregulated are denoted with an asterisk.