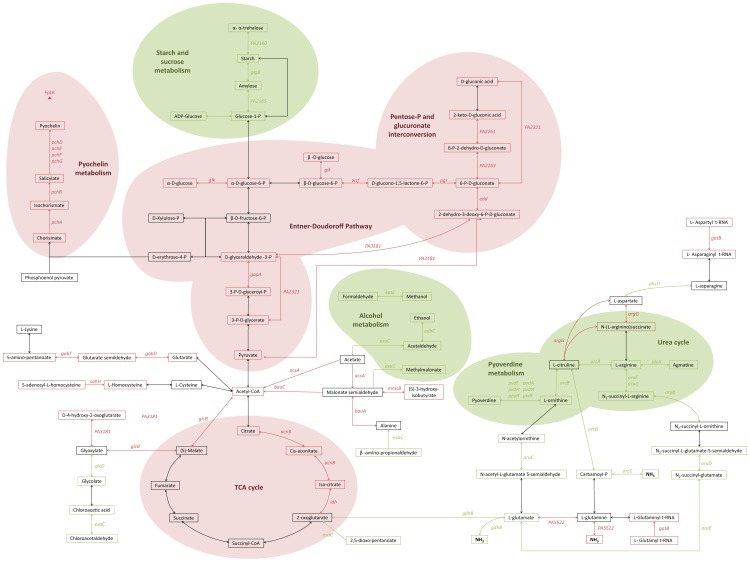
Figure 3. Pathways of P. aeruginosa differentially regulated at 22°C and 37°C.
Graphic representation of the global changes in P. aeruginosa PAO1 metabolism detected by microarray analysis. The genes significantly dysregulated at 22°C and 37°C were mapped to metabolic pathways using the Kyoto Encyclopedia of Genes and Genomes database [21]. Genes up-regulated at 22°C (green) and genes up-regulated at 37°C (red) are italicized next to the reaction catalyzed by their products. Green and red areas represent pathways globally up-regulated at 22°C and 37°C, respectively.

